FabCon is coming to Atlanta
Join us at FabCon Atlanta from March 16 - 20, 2026, for the ultimate Fabric, Power BI, AI and SQL community-led event. Save $200 with code FABCOMM.
Register now!- Power BI forums
- Get Help with Power BI
- Desktop
- Service
- Report Server
- Power Query
- Mobile Apps
- Developer
- DAX Commands and Tips
- Custom Visuals Development Discussion
- Health and Life Sciences
- Power BI Spanish forums
- Translated Spanish Desktop
- Training and Consulting
- Instructor Led Training
- Dashboard in a Day for Women, by Women
- Galleries
- Data Stories Gallery
- Themes Gallery
- Contests Gallery
- Quick Measures Gallery
- Notebook Gallery
- Translytical Task Flow Gallery
- TMDL Gallery
- R Script Showcase
- Webinars and Video Gallery
- Ideas
- Custom Visuals Ideas (read-only)
- Issues
- Issues
- Events
- Upcoming Events
To celebrate FabCon Vienna, we are offering 50% off select exams. Ends October 3rd. Request your discount now.
- Power BI forums
- Forums
- Get Help with Power BI
- Desktop
- How to link two tables for using filters from one
- Subscribe to RSS Feed
- Mark Topic as New
- Mark Topic as Read
- Float this Topic for Current User
- Bookmark
- Subscribe
- Printer Friendly Page
- Mark as New
- Bookmark
- Subscribe
- Mute
- Subscribe to RSS Feed
- Permalink
- Report Inappropriate Content
How to link two tables for using filters from one
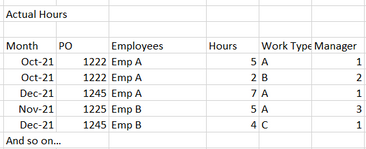
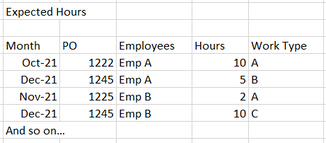
I have two data tables
- Actual Hours (this has a lot more columns than Expected Hours table)
- Expected Hours
The two tables currently linked through [Employee Dim] and [PO Dim].
DAX for Hours Diff used is:
I am trying to show the difference between the Actual hours and the Expected hours. This is proving difficult.
The issue is my filters are all from Actual Hours table (eg. Manager). When these are used they don't seem to filter out the irrelevant data…
eg.
X - axis is "Employees"
in this visual I only want to show the employees that's under, say Manager A. Not all the employees. I am not sure if it's the way the tables are linked or the way the DAX is written.
Hoping someone can shed some light on what I can do to correct this.
- Mark as New
- Bookmark
- Subscribe
- Mute
- Subscribe to RSS Feed
- Permalink
- Report Inappropriate Content
@Anonymous , You need to create common table like Employee(Employee manager) , PO, Date/Month and analyze data against common dimension
then sum('Expected Hour'[Hours]) - sum('Actual Hour'[Hours])
should work
Bridge Table: https://www.youtube.com/watch?v=Bkf35Roman8&list=PLPaNVDMhUXGaaqV92SBD5X2hk3TMNlHhb&index=19
Try to me in Star Shema
https://docs.microsoft.com/en-us/power-bi/guidance/star-schema
- Mark as New
- Bookmark
- Subscribe
- Mute
- Subscribe to RSS Feed
- Permalink
- Report Inappropriate Content
Hi @amitchandak
Thanks for the quick response. I have two 'common' tables for Employees and PO, which are then linked to both tables in question (as mentioned above).
- Mark as New
- Bookmark
- Subscribe
- Mute
- Subscribe to RSS Feed
- Permalink
- Report Inappropriate Content
@Anonymous , Date is also needed, Then you can add employee, manager from employee, PO and date from date and measure like this one
sum('Expected Hour'[Hours]) - sum('Actual Hour'[Hours])
In a visual
- Mark as New
- Bookmark
- Subscribe
- Mute
- Subscribe to RSS Feed
- Permalink
- Report Inappropriate Content
Ah good point.. dates were also joined through a Date table, but I'd used the wrong date field in table one. Fitlers working now thanks. But the amount brought back when I use
sum('Expected Hour'[Hours]) - sum('Actual Hour'[Hours])
is the same for each field.


