Join us at the 2025 Microsoft Fabric Community Conference
March 31 - April 2, 2025, in Las Vegas, Nevada. Use code MSCUST for a $150 discount! Early bird discount ends December 31.
Register Now- Power BI forums
- Get Help with Power BI
- Desktop
- Service
- Report Server
- Power Query
- Mobile Apps
- Developer
- DAX Commands and Tips
- Custom Visuals Development Discussion
- Health and Life Sciences
- Power BI Spanish forums
- Translated Spanish Desktop
- Training and Consulting
- Instructor Led Training
- Dashboard in a Day for Women, by Women
- Galleries
- Community Connections & How-To Videos
- COVID-19 Data Stories Gallery
- Themes Gallery
- Data Stories Gallery
- R Script Showcase
- Webinars and Video Gallery
- Quick Measures Gallery
- 2021 MSBizAppsSummit Gallery
- 2020 MSBizAppsSummit Gallery
- 2019 MSBizAppsSummit Gallery
- Events
- Ideas
- Custom Visuals Ideas
- Issues
- Issues
- Events
- Upcoming Events
Be one of the first to start using Fabric Databases. View on-demand sessions with database experts and the Microsoft product team to learn just how easy it is to get started. Watch now
- Power BI forums
- Forums
- Get Help with Power BI
- Desktop
- How to ignore relationship and create new measure ...
- Subscribe to RSS Feed
- Mark Topic as New
- Mark Topic as Read
- Float this Topic for Current User
- Bookmark
- Subscribe
- Printer Friendly Page
- Mark as New
- Bookmark
- Subscribe
- Mute
- Subscribe to RSS Feed
- Permalink
- Report Inappropriate Content
How to ignore relationship and create new measure based on new condition?
Hi,
I have a relationship on Date between these two datasets. I cannot delete it because I have a few charts use "Date" from Date datasets.
However, in this bar chart, I don't want to use this relationship. For example, When slicer Store="LRL FSS", Campaign="618", I would like to show x-axis as 2020.06.01~2020.06.30, when choosing other content from sclicer Store and Campaign, the x-axis data range will change.
But in this case, when I wrote measure like the following, the end date shown on the x-axis is 2020.06.21, which is based on the date to date relationship from my first picture.
So I'm wondering can it show as 2020.06.30 rather than 2020.06.21.
Another problem is, the date label on the x-axis can not show completely, why only show these three labels?
Please find attached my pbix file.
https://www.dropbox.com/s/2i3y5mttdh0vibz/test.pbix?dl=0
Not sure whether I'm expressing understood. Please let me know if there is any confusing. Thanks a lot for your time!
- Mark as New
- Bookmark
- Subscribe
- Mute
- Subscribe to RSS Feed
- Permalink
- Report Inappropriate Content
Hi @YunJ ,
Displayed as 2020.06.30:
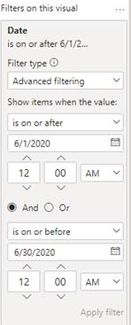
1. Put Date into Filters for manual filtering:
2. Open Show items with no data
3. Result:
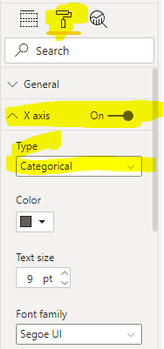
The date label on the x-axis cannot be displayed completely, you can choose this:
X axis – Type –Categorical
You can downloaded PBIX file from here.
Best Regards,
Liu Yang
If this post helps, then please consider Accept it as the solution to help the other members find it more quickly.
- Mark as New
- Bookmark
- Subscribe
- Mute
- Subscribe to RSS Feed
- Permalink
- Report Inappropriate Content
I can't put Date into Filters for manual filtering because when other contents in slicer Store/Campaign are selected, the date will change. For example, when selecting slicer Store="LRL MU" and Campaign="38", the date shown will start from 2020.03.01 to 2020.03.15.
Thanks for your time.
- Mark as New
- Bookmark
- Subscribe
- Mute
- Subscribe to RSS Feed
- Permalink
- Report Inappropriate Content
Hi @YunJ ,
You try to manually filter dates only on the bar chart.
Best Regards,
Liu Yang
If this post helps, then please consider Accept it as the solution to help the other members find it more quickly.
- Mark as New
- Bookmark
- Subscribe
- Mute
- Subscribe to RSS Feed
- Permalink
- Report Inappropriate Content
Yes... the date on the bar chart will change based on what contents in the slicers I select...
- Mark as New
- Bookmark
- Subscribe
- Mute
- Subscribe to RSS Feed
- Permalink
- Report Inappropriate Content
@YunJ , You can use all or crossfilter (with none) to remove the relationship.
https://docs.microsoft.com/en-us/dax/crossfilter-function
But if you want display date still , you might have use one more table
try crossfilter(Date[Date], campaign[date],none) - add this in calculate . - refer- https://youtu.be/e6Y-l_JtCq4
In case that does work, this is approach you have to take - https://www.youtube.com/watch?v=duMSovyosXE
At the Microsoft Analytics Community Conference, global leaders and influential voices are stepping up to share their knowledge and help you master the latest in Microsoft Fabric, Copilot, and Purview. ✨
️ November 12th-14th, 2024
Online Event
Register Here
- Mark as New
- Bookmark
- Subscribe
- Mute
- Subscribe to RSS Feed
- Permalink
- Report Inappropriate Content
Hi @amitchandak
Thanks for your reply. I tried as the following screenshot. But the new measures seems like totally the same, and the date is not ended with 2020.06.30... May I know the reason?
Thanks for your time!
Helpful resources

Join us at the Microsoft Fabric Community Conference
March 31 - April 2, 2025, in Las Vegas, Nevada. Use code MSCUST for a $150 discount!

We want your feedback!
Your insights matter. That’s why we created a quick survey to learn about your experience finding answers to technical questions.

Microsoft Fabric Community Conference 2025
Arun Ulag shares exciting details about the Microsoft Fabric Conference 2025, which will be held in Las Vegas, NV.

| User | Count |
|---|---|
| 124 | |
| 89 | |
| 84 | |
| 70 | |
| 51 |
| User | Count |
|---|---|
| 206 | |
| 146 | |
| 97 | |
| 79 | |
| 69 |


