- Power BI forums
- Updates
- News & Announcements
- Get Help with Power BI
- Desktop
- Service
- Report Server
- Power Query
- Mobile Apps
- Developer
- DAX Commands and Tips
- Custom Visuals Development Discussion
- Health and Life Sciences
- Power BI Spanish forums
- Translated Spanish Desktop
- Power Platform Integration - Better Together!
- Power Platform Integrations (Read-only)
- Power Platform and Dynamics 365 Integrations (Read-only)
- Training and Consulting
- Instructor Led Training
- Dashboard in a Day for Women, by Women
- Galleries
- Community Connections & How-To Videos
- COVID-19 Data Stories Gallery
- Themes Gallery
- Data Stories Gallery
- R Script Showcase
- Webinars and Video Gallery
- Quick Measures Gallery
- 2021 MSBizAppsSummit Gallery
- 2020 MSBizAppsSummit Gallery
- 2019 MSBizAppsSummit Gallery
- Events
- Ideas
- Custom Visuals Ideas
- Issues
- Issues
- Events
- Upcoming Events
- Community Blog
- Power BI Community Blog
- Custom Visuals Community Blog
- Community Support
- Community Accounts & Registration
- Using the Community
- Community Feedback
Register now to learn Fabric in free live sessions led by the best Microsoft experts. From Apr 16 to May 9, in English and Spanish.
- Power BI forums
- Forums
- Get Help with Power BI
- Desktop
- How to identify new 'Lead Person' by date whom hav...
- Subscribe to RSS Feed
- Mark Topic as New
- Mark Topic as Read
- Float this Topic for Current User
- Bookmark
- Subscribe
- Printer Friendly Page
- Mark as New
- Bookmark
- Subscribe
- Mute
- Subscribe to RSS Feed
- Permalink
- Report Inappropriate Content
How to identify new 'Lead Person' by date whom have not existed before?
Hi all,
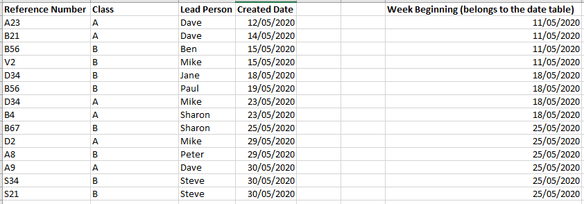
Take a look at my starting data (below). For demonstration purposes, it's a pretty simple dataset.
All the columns belong to a single table (Table A) except for the 'Week Beginning' column. This column belongs to the Table Date table which, through a relationship, filters Table A.
What I would like to do is use a 'Line and stacked column chart' visual to show the following:
1) The distinct count of Reference Numbers by Week Beginning, split by Class.
2) A line showing the distinct count of new Lead Person(s) by Week Beginning.
3) If possible, show a second line on the same visual (don't worry if this isn't possible) that shows the count of all Lead Person(s) by Week Beginning.
4) When you hover-over each line it shows a list of Lead Person names for new Lead Person(s) (for 3), or a list of all Lead Person(s) (for 4).
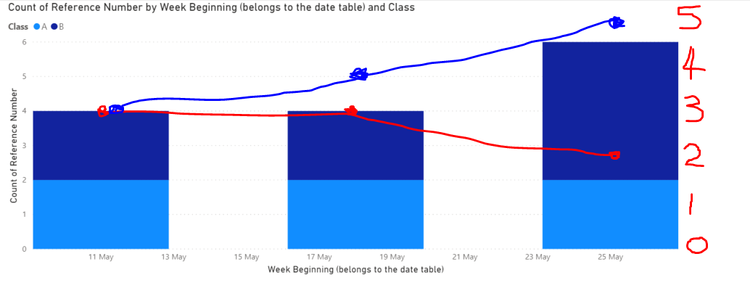
Maybe the mocked-up end-result visual will help explain what I am trying to achieve.
Reflecting the sample dataset, to break it down:
Week Beginning 11/05/2020 there were 2 unique Class A Reference Numbers, 2 unique Class B Reference Number, 3 all Lead Persons, and 3 new Lead Persons.
Week Beginning 18/05/2020 there were 2 unique Class A Reference Numbers, 2 unique Class B Reference Numbers, 4 all Lead Persons, and 3 new Lead Persons.
Week Beginning 25/05/2020 there were 2 unique Class A Reference Numbers, 4 unique Class B Reference Numbers, 5 all Lead Persons, and 2 new Lead Persons.
When I hover-over the blue line a tool-text tip appears for all unique Lead Person by Week Beginning, and when I hover-over the red line a tool-text tip appears for new unique Lead Person by Week Beginning:
Week Beginning 11/05/2020 For all unique Lead Person - Dave, Ben, Mike are listed. For new unique Lead Person Dave, Ben, Mike are listed.
Week Beginning 18/05/2020 For all unique Lead Person - Jane, Paul, Mike, Sharon are listed. For new unique Lead Person Jane, Paul, Sharon are listed.
Week Beginning 25/05/2020 For all unique Lead Person - Sharon, Mike, Peter, Dave, Steve are listed. For new unique Lead Person Peter, Steve are listed.
How can I produce this wanted visual/measure using DAX?
If you can provide me the measure details I'd be most grateful.
Thanks.
Solved! Go to Solution.
- Mark as New
- Bookmark
- Subscribe
- Mute
- Subscribe to RSS Feed
- Permalink
- Report Inappropriate Content
Hi @D_PBI ,
I create an index column to calculate new person, you could refer to my sample for details.
Best Regards,
Zoe Zhi
If this post helps, then please consider Accept it as the solution to help the other members find it more quickly.
- Mark as New
- Bookmark
- Subscribe
- Mute
- Subscribe to RSS Feed
- Permalink
- Report Inappropriate Content
@dax - thanks so much for your help. I was stumped on achieving this but having followed your approach, it seems all so easy. Thanks again, much appreacited.
- Mark as New
- Bookmark
- Subscribe
- Mute
- Subscribe to RSS Feed
- Permalink
- Report Inappropriate Content
Bump - anyone please?
Helpful resources

Microsoft Fabric Learn Together
Covering the world! 9:00-10:30 AM Sydney, 4:00-5:30 PM CET (Paris/Berlin), 7:00-8:30 PM Mexico City

Power BI Monthly Update - April 2024
Check out the April 2024 Power BI update to learn about new features.

| User | Count |
|---|---|
| 108 | |
| 96 | |
| 75 | |
| 63 | |
| 62 |
| User | Count |
|---|---|
| 142 | |
| 104 | |
| 104 | |
| 80 | |
| 66 |


