New Offer! Become a Certified Fabric Data Engineer
Check your eligibility for this 50% exam voucher offer and join us for free live learning sessions to get prepared for Exam DP-700.
Get Started- Power BI forums
- Get Help with Power BI
- Desktop
- Service
- Report Server
- Power Query
- Mobile Apps
- Developer
- DAX Commands and Tips
- Custom Visuals Development Discussion
- Health and Life Sciences
- Power BI Spanish forums
- Translated Spanish Desktop
- Training and Consulting
- Instructor Led Training
- Dashboard in a Day for Women, by Women
- Galleries
- Community Connections & How-To Videos
- COVID-19 Data Stories Gallery
- Themes Gallery
- Data Stories Gallery
- R Script Showcase
- Webinars and Video Gallery
- Quick Measures Gallery
- 2021 MSBizAppsSummit Gallery
- 2020 MSBizAppsSummit Gallery
- 2019 MSBizAppsSummit Gallery
- Events
- Ideas
- Custom Visuals Ideas
- Issues
- Issues
- Events
- Upcoming Events
Don't miss out! 2025 Microsoft Fabric Community Conference, March 31 - April 2, Las Vegas, Nevada. Use code MSCUST for a $150 discount. Prices go up February 11th. Register now.
- Power BI forums
- Forums
- Get Help with Power BI
- Desktop
- Re: How to handle positive and negative values in ...
- Subscribe to RSS Feed
- Mark Topic as New
- Mark Topic as Read
- Float this Topic for Current User
- Bookmark
- Subscribe
- Printer Friendly Page
- Mark as New
- Bookmark
- Subscribe
- Mute
- Subscribe to RSS Feed
- Permalink
- Report Inappropriate Content
How to handle positive and negative values in a dataset
Hello all,
I'm trying to replicate a report called Material Transactions that contain both positive and negative values in some columns. For an example, if I move quantity to a new location, say 2, it will show as -2 on the report. If I add quantity, the report will reflect this as positive. Same with posted amount - could either be positive or negative. This is by design. I was wondering if there's a better way to handle this and still retain the correct total quantity and total posted amount?
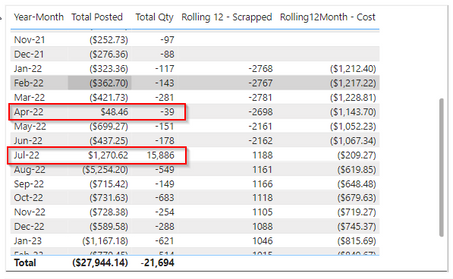
I can transform both the Total Posted and Total Qty columns to Absolute Value, but the results would be incorrect. Sometimes, there's an outlier such as Jul-22.
One of my users replicated this report in Excel and well, it's easier to simply remove the minus symbol. I'd like to match his report is possible.
Any insight is greatly appreciated. Thank you so much!
Cheers,
Lele
Solved! Go to Solution.
- Mark as New
- Bookmark
- Subscribe
- Mute
- Subscribe to RSS Feed
- Permalink
- Report Inappropriate Content
Hi @v-jingzhang,
I resolved the issue. All I had to do was do a sum of TotalPosted and TotalQty, then do a measure using ABS syntax (TotalPosted_Positive = ABS([TotalPosted]). Now my chart doesn't look like we're constantly in the negative. I was overcomplicating this... I blame Monday mornings. Many thanks for your time! Have a great one!
Cheers,
Lele
- Mark as New
- Bookmark
- Subscribe
- Mute
- Subscribe to RSS Feed
- Permalink
- Report Inappropriate Content
Hi @leletran
Sorry I may not understand your expected result correctly. Why do you think transforming the column to Absolute Value will make the results incorrect? Per my understanding, you want to remove the minus symbol for negative values and keep positive values as they are, don't you? If so, Absolute Value seems to be the easiest solution.
If I understand it incorrectly, can you share some expected result based on some positive and negative values?
Best Regards,
Community Support Team _ Jing
If this post helps, please Accept it as Solution to help other members find it.
- Mark as New
- Bookmark
- Subscribe
- Mute
- Subscribe to RSS Feed
- Permalink
- Report Inappropriate Content
Hi @v-jingzhang,
I resolved the issue. All I had to do was do a sum of TotalPosted and TotalQty, then do a measure using ABS syntax (TotalPosted_Positive = ABS([TotalPosted]). Now my chart doesn't look like we're constantly in the negative. I was overcomplicating this... I blame Monday mornings. Many thanks for your time! Have a great one!
Cheers,
Lele
- Mark as New
- Bookmark
- Subscribe
- Mute
- Subscribe to RSS Feed
- Permalink
- Report Inappropriate Content
Hi @v-jingzhang,
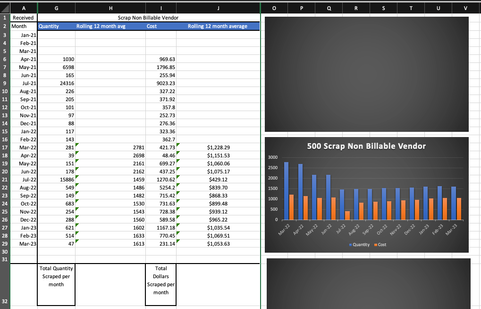
Good morning and thanks so much for your response! My apology, I might not have explained well. I want to keep both positive and negative values so they can be totaled for each month. Using Absolute Value would change the Total Posted and Total Qty amount. For example, in the Excel report, let's use Feb-23 and Mar-23 as an example, the correct amount is -514 and -47 for Total Qty, respectively. The user simply add all the quantity and total posted for the month, and remove the negative symbol to make the value a "positive". (Almost all the months are negatives except for Apr-22 for Total Posted, and Jul-22 for Total Posted and Total Qty). Using Absolute Value, Feb-23 and Mar-23 is now 2,514 and 49 for Total Qty, respectively. Total Posted is also incorrect.
Excel:
Absolute Value:
I wanted to handle both negative and positive values so when I build my chart, it doesn't look like we're in constant negative! If possible, would like for both TotalQty and TotalPosted bars to be side-by-side like the original.
Current chart (no Absolute Value):
Excel:
I hope this was as clear as mud 😅. Please let me know if additional clarification is needed. This report can be a bit confusing. Thank you!
Cheers,
Lele
Helpful resources
| User | Count |
|---|---|
| 117 | |
| 73 | |
| 58 | |
| 49 | |
| 48 |
| User | Count |
|---|---|
| 171 | |
| 122 | |
| 60 | |
| 59 | |
| 56 |


