This time we’re going bigger than ever. Fabric, Power BI, SQL, AI and more. We're covering it all. You won't want to miss it.
Learn moreLevel up your Power BI skills this month - build one visual each week and tell better stories with data! Get started
I have a single Calendar table with multiple other tables related to it by date. All of the relationships are "inactive" to avoid circular references et cetera. For my measures, it's easy enough to use USERELATIONSHIP to specify which relationship to use.
However, I have a Table visual, and I want to display all of the records related (via one of the inactive relationships) between table X and my Calendar table.
How can I do this?
Solved! Go to Solution.
To achieve your requirement, you can refer to following method:
1. Create measures to get the Max and Min date of Calendar table with expression like:
StartDate = CALCULATE ( MIN ( 'Calendar Table'[Date] ), ALLSELECTED ( 'Calendar Table' ) )
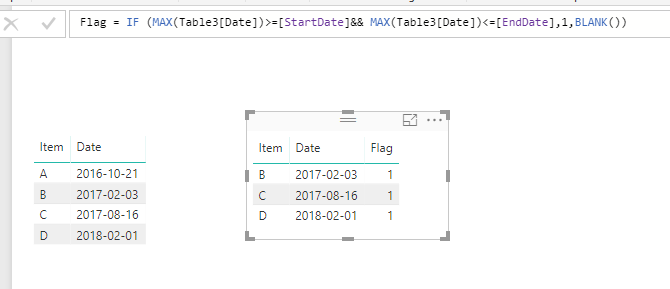
2. Create a measure in your source table to filter the records:
Flag =
IF (
MAX ( Table3[Date] ) >= [StartDate]
&& MAX ( Table3[Date] ) <= [EndDate],
1,
BLANK ()
)
Thanks,
Xi Jin.
To achieve your requirement, you can refer to following method:
1. Create measures to get the Max and Min date of Calendar table with expression like:
StartDate = CALCULATE ( MIN ( 'Calendar Table'[Date] ), ALLSELECTED ( 'Calendar Table' ) )
2. Create a measure in your source table to filter the records:
Flag =
IF (
MAX ( Table3[Date] ) >= [StartDate]
&& MAX ( Table3[Date] ) <= [EndDate],
1,
BLANK ()
)
Thanks,
Xi Jin.
Check out the April 2026 Power BI update to learn about new features.
Sign up to receive a private message when registration opens and key events begin.
If you have recently started exploring Fabric, we'd love to hear how it's going. Your feedback can help with product improvements.
| User | Count |
|---|---|
| 35 | |
| 27 | |
| 26 | |
| 22 | |
| 18 |
| User | Count |
|---|---|
| 67 | |
| 36 | |
| 32 | |
| 26 | |
| 23 |