FabCon is coming to Atlanta
Join us at FabCon Atlanta from March 16 - 20, 2026, for the ultimate Fabric, Power BI, AI and SQL community-led event. Save $200 with code FABCOMM.
Register now!- Power BI forums
- Get Help with Power BI
- Desktop
- Service
- Report Server
- Power Query
- Mobile Apps
- Developer
- DAX Commands and Tips
- Custom Visuals Development Discussion
- Health and Life Sciences
- Power BI Spanish forums
- Translated Spanish Desktop
- Training and Consulting
- Instructor Led Training
- Dashboard in a Day for Women, by Women
- Galleries
- Data Stories Gallery
- Themes Gallery
- Contests Gallery
- QuickViz Gallery
- Quick Measures Gallery
- Visual Calculations Gallery
- Notebook Gallery
- Translytical Task Flow Gallery
- TMDL Gallery
- R Script Showcase
- Webinars and Video Gallery
- Ideas
- Custom Visuals Ideas (read-only)
- Issues
- Issues
- Events
- Upcoming Events
Get Fabric Certified for FREE during Fabric Data Days. Don't miss your chance! Request now
- Power BI forums
- Forums
- Get Help with Power BI
- Desktop
- How to count rows (with conditions) in a table vis...
- Subscribe to RSS Feed
- Mark Topic as New
- Mark Topic as Read
- Float this Topic for Current User
- Bookmark
- Subscribe
- Printer Friendly Page
- Mark as New
- Bookmark
- Subscribe
- Mute
- Subscribe to RSS Feed
- Permalink
- Report Inappropriate Content
How to count rows (with conditions) in a table visual?
Hello everyone,
I have an Excel list from SAP system that contains purchased items with their PO Date and their estimated delivered date.
I'm trying to do some simple reporting which I will have a date slicer, and whenever a user specifies the start date and end date; the report will show (1) all purchased items in period from slicer (via PO date) and also (2) purchased items with estimated delivered date in period from slicer.
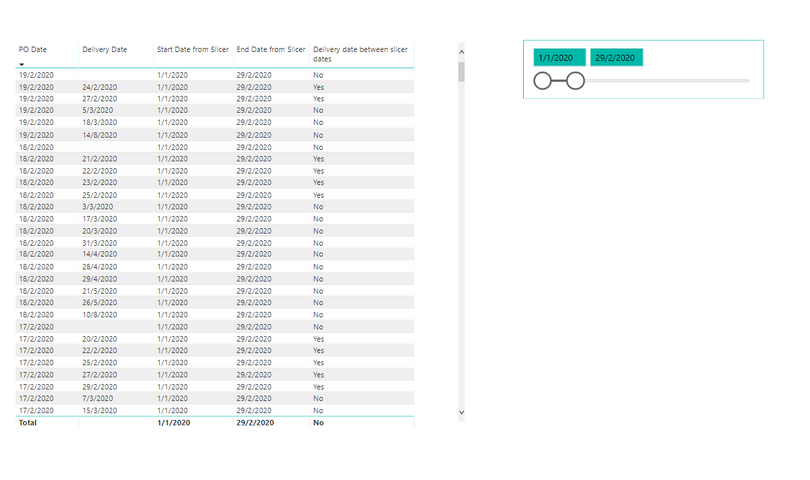
I've seem to be able to achieve it in the table visual below:
The "PO Date" and "Delivery date" are original columns from data source. "Start Date from Slicer", "End Date from Slicer" and "Delivery date between Slicer Dates" are all using Measures.
What I want to do now is to count how many rows are "Yes" in "Delivery date between Slicer Dates". I've tried using this measure but it returns Blank
Count of Yes =
COUNTROWS (
    FILTER (
        SUMMARIZE (
            SAP DATA,
            SAP DATA[PO Date],
            "Yes", [Delivery date between slicer dates]
        ),
        [Delivery date between slicer dates] = "Yes"
    )
)
Any recommendation?
By the way sorry if this is repeating. I've already tried referring here but to no avail:
https://community.powerbi.com/t5/Desktop/Table-visual-rows-count/td-p/448336
Solved! Go to Solution.
- Mark as New
- Bookmark
- Subscribe
- Mute
- Subscribe to RSS Feed
- Permalink
- Report Inappropriate Content
Hi,
You may download my PBI file from here.
Hope this helps.
Regards,
Ashish Mathur
http://www.ashishmathur.com
https://www.linkedin.com/in/excelenthusiasts/
- Mark as New
- Bookmark
- Subscribe
- Mute
- Subscribe to RSS Feed
- Permalink
- Report Inappropriate Content
Try Like
measure =
var _min = minx(Date,Date[Date])
var _max = maxx(Date,Date[Date])
return
if(max(table[Delivery_date])>=_min &&  max(table[Delivery_date])<=_max,"Yes","No")
- Mark as New
- Bookmark
- Subscribe
- Mute
- Subscribe to RSS Feed
- Permalink
- Report Inappropriate Content
Hi,
Share some dummy data in a PBI file and show the expected result there.
Regards,
Ashish Mathur
http://www.ashishmathur.com
https://www.linkedin.com/in/excelenthusiasts/
- Mark as New
- Bookmark
- Subscribe
- Mute
- Subscribe to RSS Feed
- Permalink
- Report Inappropriate Content
@Ashish_Mathur Im not sure how to share the pbix file here, but Ive put up a pbix file with its pbix file on my Google Drive.
https://drive.google.com/open?id=1FVBVSF99OlrmDvPeUFxOBmReF4SQM_Hu
- Mark as New
- Bookmark
- Subscribe
- Mute
- Subscribe to RSS Feed
- Permalink
- Report Inappropriate Content
Hi,
You may download my PBI file from here.
Hope this helps.
Regards,
Ashish Mathur
http://www.ashishmathur.com
https://www.linkedin.com/in/excelenthusiasts/
Helpful resources

Power BI Monthly Update - November 2025
Check out the November 2025 Power BI update to learn about new features.

Fabric Data Days
Advance your Data & AI career with 50 days of live learning, contests, hands-on challenges, study groups & certifications and more!

| User | Count |
|---|---|
| 104 | |
| 82 | |
| 68 | |
| 50 | |
| 46 |


