This time we’re going bigger than ever. Fabric, Power BI, SQL, AI and more. We're covering it all. You won't want to miss it.
Learn moreLevel up your Power BI skills this month - build one visual each week and tell better stories with data! Get started
Greetings,
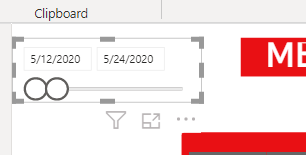
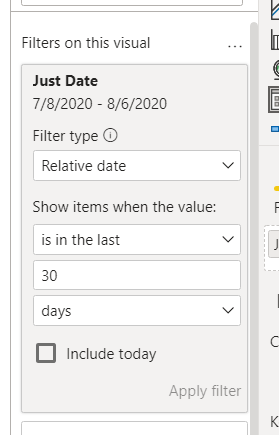
I have a visual that I want to be filtered by a slicer + and - 30 days.
Issues I am running into are one the slicer filter only will allow me to do one or the other and not both. Meaning - 30 days but not + 30 days. Two the slicer is only pulling from todays date and not the date range selected. If I pull from Jan 2020 it gives me dates from August and not January. I have two date tables in my report and the date table just for this 'Just Date' is one to many direction to the second date table that effects most of the visuals on my report. The 'Just Date' table is effecting two of the visuals however it is not giving me the 30+ or - spread I am looking for.
Solved! Go to Solution.
@Anonymous , see if this can help
Link does not work.
Aaaah,
I switched browsers it works. Looking at it now.
@Anonymous - I use The Complex Selector for this sort of thing: https://community.powerbi.com/t5/Quick-Measures-Gallery/The-Complex-Selector/m-p/1116633#M534
Check out the April 2026 Power BI update to learn about new features.
Sign up to receive a private message when registration opens and key events begin.
If you have recently started exploring Fabric, we'd love to hear how it's going. Your feedback can help with product improvements.
| User | Count |
|---|---|
| 37 | |
| 29 | |
| 28 | |
| 20 | |
| 18 |
| User | Count |
|---|---|
| 66 | |
| 36 | |
| 29 | |
| 25 | |
| 24 |