Forum Discussion
wo_guy
5 years agoFrequent Visitor
How do I overlay Log scale to Bar Chart?
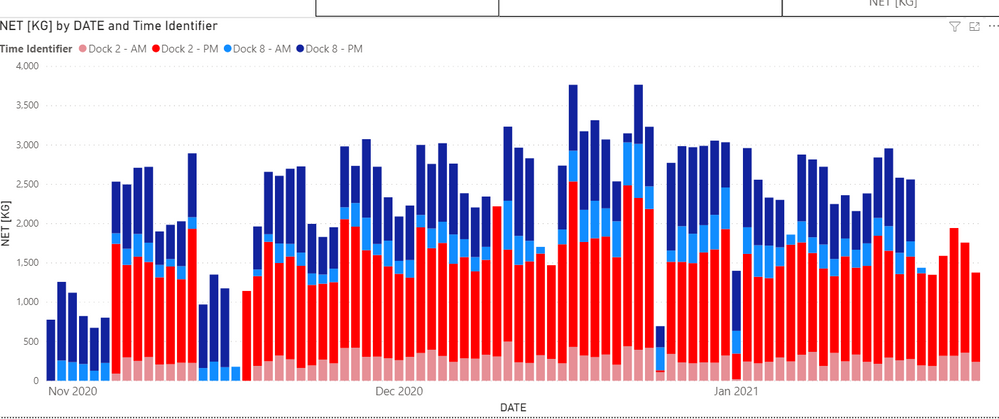
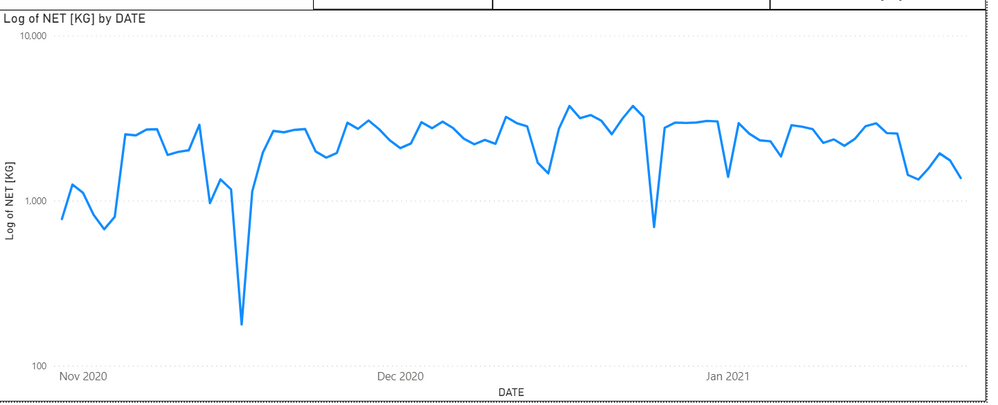
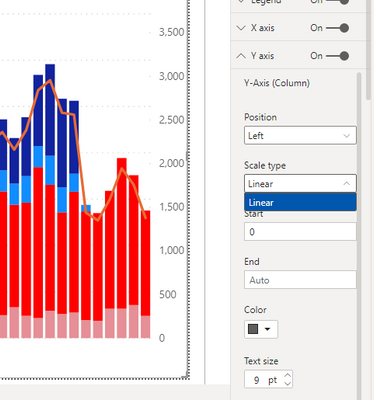
I am trying to show a Log Scale line to a Bar Chart. I created a line chart as you can find in the PBI file below but I am unable to overlay to the stacked column chart. I have tried usin...
- 5 years ago
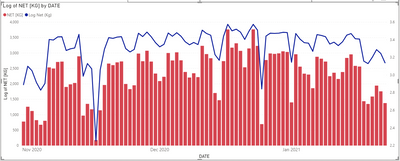
Would it work to make a measure to calculate the Log value and use that on a linear scale
Log Net (Kg) = LOG(SUM('Cycle Reports'[NET [KG]]]))Pat
wo_guy
5 years agoFrequent Visitor
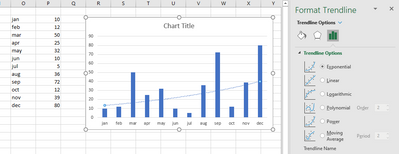
mahoneypat What would be the be the equation to show the trendline as an exponential trendline like the one you can see in excel?
The problem is that the log line is not a smoothed one (by design) and that would be the most desireable.
- mahoneypat5 years ago
Microsoft Employee
I don't think that will be easy. The Analytics panel isn't active for that visual, so you'd have to calculate the equation terms with a complex DAX expression and then another measure to add the line to the chart.
Pat