FabCon is coming to Atlanta
Join us at FabCon Atlanta from March 16 - 20, 2026, for the ultimate Fabric, Power BI, AI and SQL community-led event. Save $200 with code FABCOMM.
Register now!- Power BI forums
- Get Help with Power BI
- Desktop
- Service
- Report Server
- Power Query
- Mobile Apps
- Developer
- DAX Commands and Tips
- Custom Visuals Development Discussion
- Health and Life Sciences
- Power BI Spanish forums
- Translated Spanish Desktop
- Training and Consulting
- Instructor Led Training
- Dashboard in a Day for Women, by Women
- Galleries
- Data Stories Gallery
- Themes Gallery
- Contests Gallery
- QuickViz Gallery
- Quick Measures Gallery
- Visual Calculations Gallery
- Notebook Gallery
- Translytical Task Flow Gallery
- TMDL Gallery
- R Script Showcase
- Webinars and Video Gallery
- Ideas
- Custom Visuals Ideas (read-only)
- Issues
- Issues
- Events
- Upcoming Events
The Power BI Data Visualization World Championships is back! Get ahead of the game and start preparing now! Learn more
- Power BI forums
- Forums
- Get Help with Power BI
- Desktop
- Hierarchy help
- Subscribe to RSS Feed
- Mark Topic as New
- Mark Topic as Read
- Float this Topic for Current User
- Bookmark
- Subscribe
- Printer Friendly Page
- Mark as New
- Bookmark
- Subscribe
- Mute
- Subscribe to RSS Feed
- Permalink
- Report Inappropriate Content
Hierarchy help
Hi,
Im just wondering if there's possibly a function that would help total up however many lower levels there is in a hierarchy e.g. Building name below and display the total (400).
The reason I ask is because the first measure ( Total Bookable Hours) for the 200 below comes from an unrelated date table so it doesn't naturally sum upwards. I almost need the Total bookable hours to display for how ever many occurences of a room there is and display total for the building.
The measure reads
Ive looked into isinscope but the second part for the building I cant seem to work, and the measure totals dont seem to help.
Hope that makes sense
Thanks
Liam
Solved! Go to Solution.
- Mark as New
- Bookmark
- Subscribe
- Mute
- Subscribe to RSS Feed
- Permalink
- Report Inappropriate Content
Hi , @Anonymous
It looks like the same thread there.
So I directly tested the pbix you provide there.
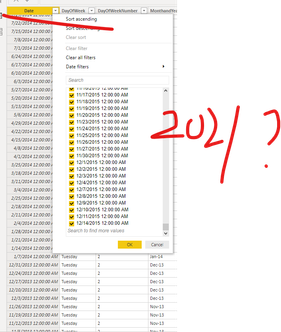
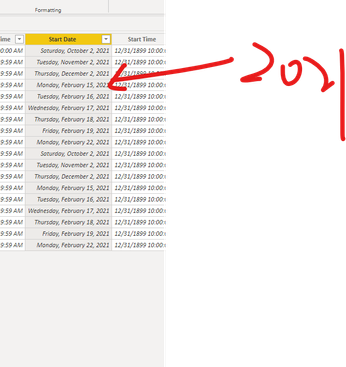
It is unreasonable to establish relationship between tables through the field "Date" and "Start date"
Through your original formula, I guess you may just want to get the result of [count of all working days in the date] * 10.
If it is , try this measure as below:
Measure =
SUMX(GROUPBY('Bookings','Bookings'[Building Name],'Bookings'[Room]),COUNTROWS(FILTER(DISTINCT('Bookings'[Start Date]),WEEKDAY([Start Date],2) IN {1,2,3,4,5})) *10 )
Best Regards,
Community Support Team _ Eason
- Mark as New
- Bookmark
- Subscribe
- Mute
- Subscribe to RSS Feed
- Permalink
- Report Inappropriate Content
Hi @v-easonf-msft ,
My apologies, I thought it had been deleted. Thankyou so much for your time and the measure.
Regards
Liam
- Mark as New
- Bookmark
- Subscribe
- Mute
- Subscribe to RSS Feed
- Permalink
- Report Inappropriate Content
@Anonymous , refer if this can help
https://www.sqlbi.com/articles/clever-hierarchy-handling-in-dax/
- Mark as New
- Bookmark
- Subscribe
- Mute
- Subscribe to RSS Feed
- Permalink
- Report Inappropriate Content
Hi @amitchandak ,
Thanks for your reply. This article relies on the measure summing upwards naturally which unfortunately my measure doesnt do.
Thanks
Liam
- Mark as New
- Bookmark
- Subscribe
- Mute
- Subscribe to RSS Feed
- Permalink
- Report Inappropriate Content
@Anonymous , Check if this can help
https://community.powerbi.com/t5/Desktop/Dynamic-measure-calculation-for-hierarchy-data/td-p/592546
- Mark as New
- Bookmark
- Subscribe
- Mute
- Subscribe to RSS Feed
- Permalink
- Report Inappropriate Content
Hi @amitchandak ,
Thanks again for replying. They are all using the SUM function from the same table which I'm unfortunately not.
I'm not sure whether its possible, as if I use the isfiltered or isinscope it will always equal the same total as the lower level. I was hoping of an alternative approach where it could total the lower level on the fly
- Mark as New
- Bookmark
- Subscribe
- Mute
- Subscribe to RSS Feed
- Permalink
- Report Inappropriate Content
Helpful resources

Power BI Monthly Update - November 2025
Check out the November 2025 Power BI update to learn about new features.

Fabric Data Days
Advance your Data & AI career with 50 days of live learning, contests, hands-on challenges, study groups & certifications and more!


