FabCon is coming to Atlanta
Join us at FabCon Atlanta from March 16 - 20, 2026, for the ultimate Fabric, Power BI, AI and SQL community-led event. Save $200 with code FABCOMM.
Register now!- Power BI forums
- Get Help with Power BI
- Desktop
- Service
- Report Server
- Power Query
- Mobile Apps
- Developer
- DAX Commands and Tips
- Custom Visuals Development Discussion
- Health and Life Sciences
- Power BI Spanish forums
- Translated Spanish Desktop
- Training and Consulting
- Instructor Led Training
- Dashboard in a Day for Women, by Women
- Galleries
- Data Stories Gallery
- Themes Gallery
- Contests Gallery
- QuickViz Gallery
- Quick Measures Gallery
- Visual Calculations Gallery
- Notebook Gallery
- Translytical Task Flow Gallery
- TMDL Gallery
- R Script Showcase
- Webinars and Video Gallery
- Ideas
- Custom Visuals Ideas (read-only)
- Issues
- Issues
- Events
- Upcoming Events
Get Fabric Certified for FREE during Fabric Data Days. Don't miss your chance! Request now
- Power BI forums
- Forums
- Get Help with Power BI
- Desktop
- Grouping in Matrix
- Subscribe to RSS Feed
- Mark Topic as New
- Mark Topic as Read
- Float this Topic for Current User
- Bookmark
- Subscribe
- Printer Friendly Page
- Mark as New
- Bookmark
- Subscribe
- Mute
- Subscribe to RSS Feed
- Permalink
- Report Inappropriate Content
Grouping in Matrix
Hi all,
Good Day. I have no idea how to generate a matrix view with Grouped items on the Row well. Please check the attached screenshot and it shows the way I wanted to group the items. Please help me how to do it in Power BI Desktop.
Note: I tried to use the "New Group option" and grouped some of the items. But, when I used that into my matrix table, it didn't showed me with the expanded group view, I mean the child items associated to a parent were not displayed. All I got was only the Parent items on the Matrix Row well. Any help will be much appreciated.
Thanks,
Praveen.
Solved! Go to Solution.
- Mark as New
- Bookmark
- Subscribe
- Mute
- Subscribe to RSS Feed
- Permalink
- Report Inappropriate Content
Hi @Anonymous
First make sure your dataset structure like below
Then add "parent" and "child" column to the Row field of a Matrix visual, then click on the fourth icon to let the row show at the lowest level.
Additional you could select Rows Headers->Stepped layout, turn off this option, you could see the picture as below.
If you have any question, please feel free to ask me.
Best Regards
Maggie
- Mark as New
- Bookmark
- Subscribe
- Mute
- Subscribe to RSS Feed
- Permalink
- Report Inappropriate Content
Million Thanks
- Mark as New
- Bookmark
- Subscribe
- Mute
- Subscribe to RSS Feed
- Permalink
- Report Inappropriate Content


Dear All,
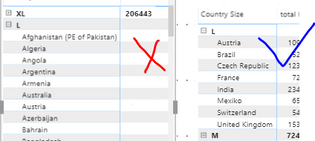
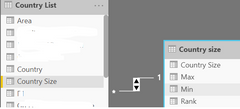
I'm having two tables from which I have created the above Matrix visuals but the requirment is that the fields are not coming in +- (expand/shrink) at Row Level, also I have turned on Values"Show on Rows" . Please note my Values are in seperate measure so that can not be moved to Row level
Best Regards
Manik Nag
- Mark as New
- Bookmark
- Subscribe
- Mute
- Subscribe to RSS Feed
- Permalink
- Report Inappropriate Content
Hi ,
Grouping works perfectly fine, but I wanted to sort the "parent" column in a particular order. So, I created supporting table with ranking and pulled the respective column from the newly created table into the matrix. Now smth went wrong and grouping does not work any more. I cant figure out why.. puzzled. If any one could help!
- Mark as New
- Bookmark
- Subscribe
- Mute
- Subscribe to RSS Feed
- Permalink
- Report Inappropriate Content
how do you write a measure for custom values for child in this structural grouping?
- Mark as New
- Bookmark
- Subscribe
- Mute
- Subscribe to RSS Feed
- Permalink
- Report Inappropriate Content
The grouping has no effect on the rows, and you can consider that a measure will be calculated as if all columns were populated in a table. If you're looking to do a different calculation depending on hierarchy level, you'll want to use a switch based on ISINSCOPE.
- Mark as New
- Bookmark
- Subscribe
- Mute
- Subscribe to RSS Feed
- Permalink
- Report Inappropriate Content
Thank you very much Maggie for your kind reply to my question. Keep answering to all of our questions.
God bless you and family,
Praveen.
Helpful resources

Power BI Monthly Update - November 2025
Check out the November 2025 Power BI update to learn about new features.

Fabric Data Days
Advance your Data & AI career with 50 days of live learning, contests, hands-on challenges, study groups & certifications and more!

| User | Count |
|---|---|
| 103 | |
| 80 | |
| 63 | |
| 50 | |
| 45 |


