Join us at the 2025 Microsoft Fabric Community Conference
Microsoft Fabric Community Conference 2025, March 31 - April 2, Las Vegas, Nevada. Use code MSCUST for a $150 discount.
Register now- Power BI forums
- Get Help with Power BI
- Desktop
- Service
- Report Server
- Power Query
- Mobile Apps
- Developer
- DAX Commands and Tips
- Custom Visuals Development Discussion
- Health and Life Sciences
- Power BI Spanish forums
- Translated Spanish Desktop
- Training and Consulting
- Instructor Led Training
- Dashboard in a Day for Women, by Women
- Galleries
- Webinars and Video Gallery
- Data Stories Gallery
- Themes Gallery
- Contests Gallery
- Quick Measures Gallery
- R Script Showcase
- COVID-19 Data Stories Gallery
- Community Connections & How-To Videos
- 2021 MSBizAppsSummit Gallery
- 2020 MSBizAppsSummit Gallery
- 2019 MSBizAppsSummit Gallery
- Events
- Ideas
- Custom Visuals Ideas
- Issues
- Issues
- Events
- Upcoming Events
The Power BI DataViz World Championships are on! With four chances to enter, you could win a spot in the LIVE Grand Finale in Las Vegas. Show off your skills.
- Power BI forums
- Forums
- Get Help with Power BI
- Desktop
- Re: Grouping Dates By Month
- Subscribe to RSS Feed
- Mark Topic as New
- Mark Topic as Read
- Float this Topic for Current User
- Bookmark
- Subscribe
- Printer Friendly Page
- Mark as New
- Bookmark
- Subscribe
- Mute
- Subscribe to RSS Feed
- Permalink
- Report Inappropriate Content
Grouping Dates By Month
I have a column in table "Accounts" called "Created Date". In a line chart, the data is showing by day. I want it to show by month.
I have spent two hours trying to figure this out myself. I created a "date table". I set a many:many relationship between Accounts(Created Date) and Date(Date). The line chart is still not grouping by month.
What am I missing?
Solved! Go to Solution.
- Mark as New
- Bookmark
- Subscribe
- Mute
- Subscribe to RSS Feed
- Permalink
- Report Inappropriate Content
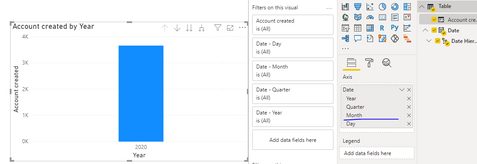
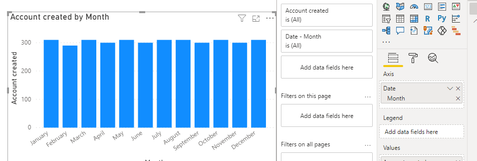
You can just use date hierarchy remove day, quarter and year, use month as the axis. See example:
Paul Zheng _ Community Support Team
If this post helps, please Accept it as the solution to help the other members find it more quickly.
- Mark as New
- Bookmark
- Subscribe
- Mute
- Subscribe to RSS Feed
- Permalink
- Report Inappropriate Content
Click on the date field. The "Column Tool" option is enabled above in the horizontal bar.
In that tab click on "Data Group"
New data group
Discretization size you mark 1 and select month, or 2 and month and year, etc.
Ready.
- Mark as New
- Bookmark
- Subscribe
- Mute
- Subscribe to RSS Feed
- Permalink
- Report Inappropriate Content
You can just use date hierarchy remove day, quarter and year, use month as the axis. See example:
Paul Zheng _ Community Support Team
If this post helps, please Accept it as the solution to help the other members find it more quickly.
- Mark as New
- Bookmark
- Subscribe
- Mute
- Subscribe to RSS Feed
- Permalink
- Report Inappropriate Content
Why do you have a many to many relationship? It should be one to many. Do you have a month column in your calendar table that you are using? You should have. You also need a sort column for month to over ride the alpha sort order.
I have a general article on calendar tables here https://exceleratorbi.com.au/power-pivot-calendar-tables/
* Matt is an 8 times Microsoft MVP (Power BI) and author of the Power BI Book Supercharge Power BI.
I will not give you bad advice, even if you unknowingly ask for it.
- Mark as New
- Bookmark
- Subscribe
- Mute
- Subscribe to RSS Feed
- Permalink
- Report Inappropriate Content
Thanks. I have changed it to many:one and still don't understand what to do.
Here is my date table dax:
Here is my date table:
Here is how my visualization is set up:
Here is what I am seeing (this is what I want to group by month):
- Mark as New
- Bookmark
- Subscribe
- Mute
- Subscribe to RSS Feed
- Permalink
- Report Inappropriate Content
Remove CreatedDate from settings, leave only YearMonthShort


