Join us at the 2025 Microsoft Fabric Community Conference
March 31 - April 2, 2025, in Las Vegas, Nevada. Use code MSCUST for a $150 discount! Early bird discount ends December 31.
Register Now- Power BI forums
- Get Help with Power BI
- Desktop
- Service
- Report Server
- Power Query
- Mobile Apps
- Developer
- DAX Commands and Tips
- Custom Visuals Development Discussion
- Health and Life Sciences
- Power BI Spanish forums
- Translated Spanish Desktop
- Training and Consulting
- Instructor Led Training
- Dashboard in a Day for Women, by Women
- Galleries
- Community Connections & How-To Videos
- COVID-19 Data Stories Gallery
- Themes Gallery
- Data Stories Gallery
- R Script Showcase
- Webinars and Video Gallery
- Quick Measures Gallery
- 2021 MSBizAppsSummit Gallery
- 2020 MSBizAppsSummit Gallery
- 2019 MSBizAppsSummit Gallery
- Events
- Ideas
- Custom Visuals Ideas
- Issues
- Issues
- Events
- Upcoming Events
Be one of the first to start using Fabric Databases. View on-demand sessions with database experts and the Microsoft product team to learn just how easy it is to get started. Watch now
- Power BI forums
- Forums
- Get Help with Power BI
- Desktop
- Filter the Axis with measure
- Subscribe to RSS Feed
- Mark Topic as New
- Mark Topic as Read
- Float this Topic for Current User
- Bookmark
- Subscribe
- Printer Friendly Page
- Mark as New
- Bookmark
- Subscribe
- Mute
- Subscribe to RSS Feed
- Permalink
- Report Inappropriate Content
Filter the Axis with measure
Hi,
I have a Hierarchial Calender Year, Month, Week.
My Data is on a Weekly scale.
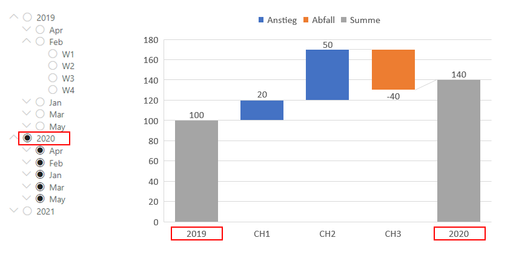
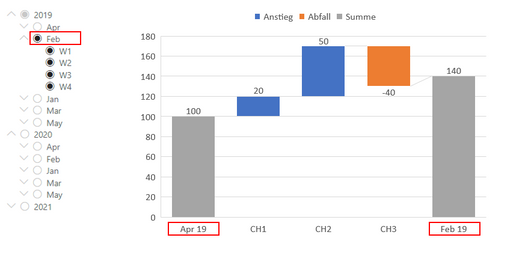
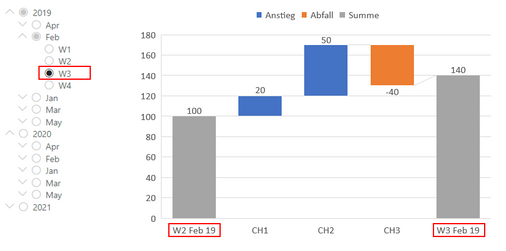
I want to show either weeks, month (aggregated weeks) or years (also aggregated weeks) in a waterfallvisual.
The user always just wants to see a comparison of two weeks, month or years. And only the one selected by the user and the one which is cronoligical before that. Best without using an additional slicer for selecting the granularity.
Example:
So as far as i know i need an axis in an extra table which has the connection to all these data in a year, month and week format. But how can i say that measure, that it should be only filtered eather yearly, monthly or weekly and in addition should be only filtered by the selected value and the one cronoligical before that?
i tried a bit around and have an example file here pbix
does anybody have an idea?
thanks for that 🙂
Solved! Go to Solution.
- Mark as New
- Bookmark
- Subscribe
- Mute
- Subscribe to RSS Feed
- Permalink
- Report Inappropriate Content
Hi @elaj,
To acheive what you are looking for I did the following:
- added a new column in the Axis Query called Axis_Type
if Text.Length([Axis]) =4 then "Year" else if Text.Length([Axis]) =8 then "Month" else "Week"
- added two order by columns to the Calendar Query, ranks to get context for moving back in time, this involved grouping and expansion so I will paste the entire power query expression
let
    Quelle = Table.FromRows(Json.Document(Binary.Decompress(Binary.FromText("bdKxagNBEIPhd3Ht4laaxqWbFIHUKYwxDqQ1Id28fZaFIzPSNTZ7fMXwo9vthG1cHu/P1+NznM7rNf/me/7OL/dzFTABETRBEWEi/sXb91e7Y77ljiVgAiJogiLCRLnj4/nb7phvuWMJmIAImqCIMFHuuP70O+Zb7lgCJiCCJigiTLQeKT3SeqT0SOuR0iOtR0qPrHdgqzvF5jvdBUxABE1QRJgod5SdLiE73QVMQARNUESYKHeUnS4hO90FTEAETVBEmCh3lJ0uITvdBUxABE1QRJhoPVJ6pPVI6ZHWI6VHWo+UHn2no+10HOx0tJ0WARE0QRFhotxRdzoOdjraTouACJqgiDBR7qg7HQc7HW2nRUAETVBEmCh31J2Og52OttMiIIImKCJMtB4pPdJ6pPRI65HSI61HSo99p/c/", BinaryEncoding.Base64), Compression.Deflate)), let _t = ((type nullable text) meta [Serialized.Text = true]) in type table [ID = _t, year = _t, month = _t, week = _t]),
    #"Geänderter Typ" = Table.TransformColumnTypes(Quelle,{{"ID", type text}, {"year", Int64.Type}, {"month", type text}, {"week", type text}}),
    #"Added Custom" = Table.AddColumn(#"Geänderter Typ", "Custom", each Number.ToText([year])&"-"&[month] &"-"& "01"),
    #"Changed Type" = Table.TransformColumnTypes(#"Added Custom",{{"Custom", type date}}),
    #"Renamed Columns" = Table.RenameColumns(#"Changed Type",{{"Custom", "Date"}}),
    #"Inserted Lowercased Text" = Table.AddColumn(#"Renamed Columns", "monthOrder", each Date.ToText([Date], "yyyyMM")),
    #"Added Custom1" = Table.AddColumn(#"Inserted Lowercased Text", "weekOrder", each Date.ToText([Date], "yyyyMM")&"0"&Text.End([week],1)),
    #"Sorted Rows" = Table.Sort(#"Added Custom1",{{"weekOrder", Order.Ascending}}),
    #"Added Index" = Table.AddIndexColumn(#"Sorted Rows", "Index", 1, 1, Int64.Type),
    #"Grouped Rows" = Table.Group(#"Added Index", {"monthOrder"}, {{"Count", each _, type table [ID=nullable text, year=nullable number, month=nullable text, week=nullable text, Date=nullable date, monthOrder=text, weekOrder=text, Index=number]}}),
    #"Added Index1" = Table.AddIndexColumn(#"Grouped Rows", "MonthOrderBy", 1, 1, Int64.Type),
    #"Expanded Count" = Table.ExpandTableColumn(#"Added Index1", "Count", {"ID", "year", "month", "week", "Date", "Index"}, {"Count.ID", "Count.year", "Count.month", "Count.week", "Count.Date", "Count.Index"}),
    #"Renamed Columns1" = Table.RenameColumns(#"Expanded Count",{{"Count.Index", "WeekOrderBy"}, {"Count.Date", "Date"}, {"Count.week", "week"}, {"Count.month", "month"}, {"Count.year", "year"}, {"Count.ID", "ID"}})
in
    #"Renamed Columns1"
- Added one calc columns to the Axis Table to get the value to navigate back in time with
lookback =
var _id = [ID]
var _axis_type = [Axis_Type]
return
SWITCH(_axis_type,
"Year", CALCULATE(max('calendar'[year]), FILTER('calendar', 'calendar'[ID] = _id)),
"Week", CALCULATE(max('calendar'[WeekOrderBy]), FILTER('calendar', 'calendar'[ID] = _id)),
"Month", CALCULATE(max('calendar'[MonthOrderBy]), FILTER('calendar', 'calendar'[ID] = _id)))
- removed the relationship between calendar and axis
- Created a measure that displays the selected and prior period in the waterfall with Axis on the X axis
Axis Measure =
var _date_type =
SWITCH(TRUE(),
    HASONEVALUE('calendar'[WeekOrderBy]), "week",
    HASONEVALUE('calendar'[month]), "month",
    HASONEVALUE('calendar'[year]), "year")
return
SWITCH(true(),
    _date_type = "week" && SELECTEDVALUE('Axis'[Axis_Type]) = "week"
    && VALUES('Axis'[lookback]) >= SELECTEDVALUE('calendar'[WeekOrderBy])-1 && VALUES('Axis'[lookback]) <= SELECTEDVALUE('calendar'[WeekOrderBy]), CALCULATE(SUM(data[value]), FILTER(ALL('calendar'), 'calendar'[ID] = SELECTEDVALUE('Axis'[ID]))),
    _date_type = "month" && SELECTEDVALUE('Axis'[Axis_Type]) = "month"
    && VALUES('Axis'[lookback]) >= SELECTEDVALUE('calendar'[MonthOrderBy])-1 && VALUES('Axis'[lookback]) <= SELECTEDVALUE('calendar'[MonthOrderBy]), CALCULATE(SUM(data[value]), FILTER(ALL('calendar'), 'calendar'[MonthOrderBy] = SELECTEDVALUE('Axis'[lookback]))),
        _date_type = "year" && SELECTEDVALUE('Axis'[Axis_Type]) = "year"
    && VALUES('Axis'[lookback]) >= SELECTEDVALUE('calendar'[year])-1 && VALUES('Axis'[lookback]) <= SELECTEDVALUE('calendar'[year]), CALCULATE(SUM(data[value]), FILTER(ALL('calendar'), 'calendar'[year] = SELECTEDVALUE('Axis'[lookback])))
)
- results in the following

attached you will find the pbix file you provided with the updates made.
Hope this works for you!
I hope this helps,
Richard
Did I answer your question? Mark my post as a solution! Kudos Appreciated!
Proud to be a Super User!
- Mark as New
- Bookmark
- Subscribe
- Mute
- Subscribe to RSS Feed
- Permalink
- Report Inappropriate Content
Hi,
If I have understood your issue correct, your want to control the category of the waterfall chart (week/month/year).
If so, you can use bookmarks and buttons/shapes to control the output of a visual.
More about bookmarks here: https://docs.microsoft.com/en-us/power-bi/create-reports/desktop-bookmarks
If this is not what you're looking for, please let me know
- Mark as New
- Bookmark
- Subscribe
- Mute
- Subscribe to RSS Feed
- Permalink
- Report Inappropriate Content
@emilmorkeberg
Hi,
I am already aware of the bookmark solution. And normally i would do it like that. But the customer doesnt want to have bookmarks. Also they dont want to have too much confusing things to do on the users side. The second thing is... even when i would use bookmarks.. i dont know how to filter just the selected year/month/week and the one before it.
- Mark as New
- Bookmark
- Subscribe
- Mute
- Subscribe to RSS Feed
- Permalink
- Report Inappropriate Content
Hi @elaj,
To acheive what you are looking for I did the following:
- added a new column in the Axis Query called Axis_Type
if Text.Length([Axis]) =4 then "Year" else if Text.Length([Axis]) =8 then "Month" else "Week"
- added two order by columns to the Calendar Query, ranks to get context for moving back in time, this involved grouping and expansion so I will paste the entire power query expression
let
    Quelle = Table.FromRows(Json.Document(Binary.Decompress(Binary.FromText("bdKxagNBEIPhd3Ht4laaxqWbFIHUKYwxDqQ1Id28fZaFIzPSNTZ7fMXwo9vthG1cHu/P1+NznM7rNf/me/7OL/dzFTABETRBEWEi/sXb91e7Y77ljiVgAiJogiLCRLnj4/nb7phvuWMJmIAImqCIMFHuuP70O+Zb7lgCJiCCJigiTLQeKT3SeqT0SOuR0iOtR0qPrHdgqzvF5jvdBUxABE1QRJgod5SdLiE73QVMQARNUESYKHeUnS4hO90FTEAETVBEmCh3lJ0uITvdBUxABE1QRJhoPVJ6pPVI6ZHWI6VHWo+UHn2no+10HOx0tJ0WARE0QRFhotxRdzoOdjraTouACJqgiDBR7qg7HQc7HW2nRUAETVBEmCh31J2Og52OttMiIIImKCJMtB4pPdJ6pPRI65HSI61HSo99p/c/", BinaryEncoding.Base64), Compression.Deflate)), let _t = ((type nullable text) meta [Serialized.Text = true]) in type table [ID = _t, year = _t, month = _t, week = _t]),
    #"Geänderter Typ" = Table.TransformColumnTypes(Quelle,{{"ID", type text}, {"year", Int64.Type}, {"month", type text}, {"week", type text}}),
    #"Added Custom" = Table.AddColumn(#"Geänderter Typ", "Custom", each Number.ToText([year])&"-"&[month] &"-"& "01"),
    #"Changed Type" = Table.TransformColumnTypes(#"Added Custom",{{"Custom", type date}}),
    #"Renamed Columns" = Table.RenameColumns(#"Changed Type",{{"Custom", "Date"}}),
    #"Inserted Lowercased Text" = Table.AddColumn(#"Renamed Columns", "monthOrder", each Date.ToText([Date], "yyyyMM")),
    #"Added Custom1" = Table.AddColumn(#"Inserted Lowercased Text", "weekOrder", each Date.ToText([Date], "yyyyMM")&"0"&Text.End([week],1)),
    #"Sorted Rows" = Table.Sort(#"Added Custom1",{{"weekOrder", Order.Ascending}}),
    #"Added Index" = Table.AddIndexColumn(#"Sorted Rows", "Index", 1, 1, Int64.Type),
    #"Grouped Rows" = Table.Group(#"Added Index", {"monthOrder"}, {{"Count", each _, type table [ID=nullable text, year=nullable number, month=nullable text, week=nullable text, Date=nullable date, monthOrder=text, weekOrder=text, Index=number]}}),
    #"Added Index1" = Table.AddIndexColumn(#"Grouped Rows", "MonthOrderBy", 1, 1, Int64.Type),
    #"Expanded Count" = Table.ExpandTableColumn(#"Added Index1", "Count", {"ID", "year", "month", "week", "Date", "Index"}, {"Count.ID", "Count.year", "Count.month", "Count.week", "Count.Date", "Count.Index"}),
    #"Renamed Columns1" = Table.RenameColumns(#"Expanded Count",{{"Count.Index", "WeekOrderBy"}, {"Count.Date", "Date"}, {"Count.week", "week"}, {"Count.month", "month"}, {"Count.year", "year"}, {"Count.ID", "ID"}})
in
    #"Renamed Columns1"
- Added one calc columns to the Axis Table to get the value to navigate back in time with
lookback =
var _id = [ID]
var _axis_type = [Axis_Type]
return
SWITCH(_axis_type,
"Year", CALCULATE(max('calendar'[year]), FILTER('calendar', 'calendar'[ID] = _id)),
"Week", CALCULATE(max('calendar'[WeekOrderBy]), FILTER('calendar', 'calendar'[ID] = _id)),
"Month", CALCULATE(max('calendar'[MonthOrderBy]), FILTER('calendar', 'calendar'[ID] = _id)))
- removed the relationship between calendar and axis
- Created a measure that displays the selected and prior period in the waterfall with Axis on the X axis
Axis Measure =
var _date_type =
SWITCH(TRUE(),
    HASONEVALUE('calendar'[WeekOrderBy]), "week",
    HASONEVALUE('calendar'[month]), "month",
    HASONEVALUE('calendar'[year]), "year")
return
SWITCH(true(),
    _date_type = "week" && SELECTEDVALUE('Axis'[Axis_Type]) = "week"
    && VALUES('Axis'[lookback]) >= SELECTEDVALUE('calendar'[WeekOrderBy])-1 && VALUES('Axis'[lookback]) <= SELECTEDVALUE('calendar'[WeekOrderBy]), CALCULATE(SUM(data[value]), FILTER(ALL('calendar'), 'calendar'[ID] = SELECTEDVALUE('Axis'[ID]))),
    _date_type = "month" && SELECTEDVALUE('Axis'[Axis_Type]) = "month"
    && VALUES('Axis'[lookback]) >= SELECTEDVALUE('calendar'[MonthOrderBy])-1 && VALUES('Axis'[lookback]) <= SELECTEDVALUE('calendar'[MonthOrderBy]), CALCULATE(SUM(data[value]), FILTER(ALL('calendar'), 'calendar'[MonthOrderBy] = SELECTEDVALUE('Axis'[lookback]))),
        _date_type = "year" && SELECTEDVALUE('Axis'[Axis_Type]) = "year"
    && VALUES('Axis'[lookback]) >= SELECTEDVALUE('calendar'[year])-1 && VALUES('Axis'[lookback]) <= SELECTEDVALUE('calendar'[year]), CALCULATE(SUM(data[value]), FILTER(ALL('calendar'), 'calendar'[year] = SELECTEDVALUE('Axis'[lookback])))
)
- results in the following

attached you will find the pbix file you provided with the updates made.
Hope this works for you!
I hope this helps,
Richard
Did I answer your question? Mark my post as a solution! Kudos Appreciated!
Proud to be a Super User!
Helpful resources

Join us at the Microsoft Fabric Community Conference
March 31 - April 2, 2025, in Las Vegas, Nevada. Use code MSCUST for a $150 discount!

Microsoft Fabric Community Conference 2025
Arun Ulag shares exciting details about the Microsoft Fabric Conference 2025, which will be held in Las Vegas, NV.

| User | Count |
|---|---|
| 120 | |
| 77 | |
| 59 | |
| 53 | |
| 40 |
| User | Count |
|---|---|
| 193 | |
| 106 | |
| 88 | |
| 62 | |
| 51 |


