FabCon is coming to Atlanta
Join us at FabCon Atlanta from March 16 - 20, 2026, for the ultimate Fabric, Power BI, AI and SQL community-led event. Save $200 with code FABCOMM.
Register now!- Power BI forums
- Get Help with Power BI
- Desktop
- Service
- Report Server
- Power Query
- Mobile Apps
- Developer
- DAX Commands and Tips
- Custom Visuals Development Discussion
- Health and Life Sciences
- Power BI Spanish forums
- Translated Spanish Desktop
- Training and Consulting
- Instructor Led Training
- Dashboard in a Day for Women, by Women
- Galleries
- Data Stories Gallery
- Themes Gallery
- Contests Gallery
- QuickViz Gallery
- Quick Measures Gallery
- Visual Calculations Gallery
- Notebook Gallery
- Translytical Task Flow Gallery
- TMDL Gallery
- R Script Showcase
- Webinars and Video Gallery
- Ideas
- Custom Visuals Ideas (read-only)
- Issues
- Issues
- Events
- Upcoming Events
The Power BI Data Visualization World Championships is back! Get ahead of the game and start preparing now! Learn more
- Power BI forums
- Forums
- Get Help with Power BI
- Desktop
- Filter Power BI data based on Selected filter rang...
- Subscribe to RSS Feed
- Mark Topic as New
- Mark Topic as Read
- Float this Topic for Current User
- Bookmark
- Subscribe
- Printer Friendly Page
- Mark as New
- Bookmark
- Subscribe
- Mute
- Subscribe to RSS Feed
- Permalink
- Report Inappropriate Content
Filter Power BI data based on Selected filter range value
Hi Folks!!
I have table data as below
| Project | Type | Year | Measure |
| P-1 | A | 2017 | 100 |
| P-1 | A | 2017 | 50 |
| P-1 | A | 2017 | 10 |
| P-1 | A | 2018 | 20 |
| P-1 | A | 2018 | 55 |
| P-1 | A | 2019 | 75 |
| P-1 | A | 2019 | 85 |
| P-1 | A | 2019 | 90 |
Filters are
Range : holds four entry such as <25%; 25-50%; 50-75%; 75-100% - Single value Select filter
Year : can have multiple year such as 2017,2018,2019 - Multi value select filter
Type : Hold all the value of Type - Single select value filter
I need to filter out data based on PERCENTAGE OF MEASURE out of sum of MEASURE of selected data.
To elaborate
User has select the below combination of filter
TYPE="A";
YEAR=2017
RANGE =<25%;
RANGE <=25% means is percentage of Measure against sum of measure in complete selected data; Measure/SUM(Measure); example elaborated below
Below, range has been calculated as below
| Type | Year | Measure | Range % | |
| A | 2017 | 100 | (100/160)*100 = 62.5% | |
| A | 2017 | 50 | (50/160)*100 = 31.25% | |
| A | 2017 | 10 | (50/160)*100 = 6.25% |
Now, for above selected range, only third records with Measure 10 will qualify for the output as it is 6.25 i.e. less than 25%
i.e. for TYPE="A"; YEAR=2017 and RANGE =<25%;, only third row with Measure=10 will qualify for the output.
Similarly, If user SELECTED multiple year 2017 and 2018 from YEAR filter, then percentage need to calculated based on sum of measure for both 2017 and 2018 year, i.e; MEASURE/SUM of MEASURE OF YEAR 2017 + SUM of MEASURE of YEAR 2018.
Please suggest!!
Thanks
Amit
- Mark as New
- Bookmark
- Subscribe
- Mute
- Subscribe to RSS Feed
- Permalink
- Report Inappropriate Content
Hi,
Share the download link of your PBI file in which you have already written the measure.
Regards,
Ashish Mathur
http://www.ashishmathur.com
https://www.linkedin.com/in/excelenthusiasts/
- Mark as New
- Bookmark
- Subscribe
- Mute
- Subscribe to RSS Feed
- Permalink
- Report Inappropriate Content
Hi Ashish,
Please share your email id as I am not getting any option to attach file here in Power BI Community page.
Also, I have official One drive where I am not allowed to share file with outside organization.
My Email Id : amit.260183@hotmail.com
Thanks
Amit Srivastava
- Mark as New
- Bookmark
- Subscribe
- Mute
- Subscribe to RSS Feed
- Permalink
- Report Inappropriate Content
Hi,
Upload your file to Google Drive and share the download link here.
Regards,
Ashish Mathur
http://www.ashishmathur.com
https://www.linkedin.com/in/excelenthusiasts/
- Mark as New
- Bookmark
- Subscribe
- Mute
- Subscribe to RSS Feed
- Permalink
- Report Inappropriate Content
Hi Ashish,
I have attached the file at OneDrive, please find the same
https://1drv.ms/u/s!Ahtm7otFIxr8avFXPCCDD0s64aU?e=QkTHKE
Please let me know in case you have any problem in accessing the same.
Thanks
Amit
- Mark as New
- Bookmark
- Subscribe
- Mute
- Subscribe to RSS Feed
- Permalink
- Report Inappropriate Content
Hi,
You may download my PBI file from here.
Hope this helps.
Regards,
Ashish Mathur
http://www.ashishmathur.com
https://www.linkedin.com/in/excelenthusiasts/
- Mark as New
- Bookmark
- Subscribe
- Mute
- Subscribe to RSS Feed
- Permalink
- Report Inappropriate Content
Hi Ashish,
Thanks for the reply.
I have gone through your PBI and below are my findings
Bucket Filter : When I have selected <25% in bucket filter, its not filtering table properly, even records those having more than 25% are qualifying for this filter which is not correct, as an example. In snapshot (which you have provided), Project =P-3 with amount =50 must not be part of the result set but it coming as a part of result set, please help.
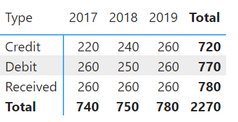
My ultimate requirement is when user selects Bucket <25%, then table will have only those records where % of amount with total amount (Amount/Total Amount) is less than <25%, and once will have this dataset, then need to display summarized report via Matrix report (i.e. Matrix report will built on only data which is available after applying Bucket<25% filter), layout of report looks somewhat similar to the below (numbers shown are dummy records).
Can understand, as logic you suggested is based on row to row basis so it will not work on summarized data, can you please help me how to do it in Matrix report.
Thanks
Amit
- Mark as New
- Bookmark
- Subscribe
- Mute
- Subscribe to RSS Feed
- Permalink
- Report Inappropriate Content
You are welcome. 50/220 = 22.72%. Since this is <25%, this row should show up.
Regards,
Ashish Mathur
http://www.ashishmathur.com
https://www.linkedin.com/in/excelenthusiasts/
- Mark as New
- Bookmark
- Subscribe
- Mute
- Subscribe to RSS Feed
- Permalink
- Report Inappropriate Content
HI Ashish,
Yes, it will.
And how I would have below implementation on top of this data.
My ultimate requirement is when user selects Bucket <25%, then table will have only those records where % of amount with total amount (Amount/Total Amount) is less than <25%, and once will have this dataset, then need to display summarized report via Matrix report (i.e. Matrix report will built on only data which is available after applying Bucket<25% filter), layout of report looks somewhat similar to the below (numbers shown are dummy records).
Can understand, as logic you suggested is based on row to row basis so it will not work on summarized data, can you please help me how to do it in Matrix report.
Please suggest!!
Thanks
Amit
- Mark as New
- Bookmark
- Subscribe
- Mute
- Subscribe to RSS Feed
- Permalink
- Report Inappropriate Content
I am not sure of how to solve your matrix visualisation question. Someone else will help you.
Regards,
Ashish Mathur
http://www.ashishmathur.com
https://www.linkedin.com/in/excelenthusiasts/
- Mark as New
- Bookmark
- Subscribe
- Mute
- Subscribe to RSS Feed
- Permalink
- Report Inappropriate Content
Hi @amsrivastavaa ,
Here are the steps you can follow:
1. Create calculated table.
Year_Slicer =
DISTINCT('Table'[Year])
2. Enter data – Create table.
3. Create measure.
value =
var _selectyear=SELECTCOLUMNS('Year_Slicer',"Year",[Year])
var _sunmall=
SUMX(FILTER(ALL('Table'),
'Table'[Year] in _selectyear&&'Table'[Type]=MAX('Table'[Type])),[Measure])
return
DIVIDE(MAX('Table'[Measure]),_sunmall)
Flag =
var _selectrange=SELECTEDVALUE('Range_Slicer'[Range])
var _selectyear=SELECTCOLUMNS('Year_Slicer',"Year",[Year])
return
SWITCH(
TRUE(),
MAX('Range_Slicer'[Range])="<25%"&&[value]<0.25&&MAX('Table'[Year]) in _selectyear,1,
MAX('Range_Slicer'[Range])="25-50%"&&[value]>=0.25&&[value]<0.5&&MAX('Table'[Year]) in _selectyear,1,
MAX('Range_Slicer'[Range])="50-75%"&&[value]>=0.5&&[value]<0.75&&MAX('Table'[Year]) in _selectyear,1,
MAX('Range_Slicer'[Range])="75-100%"&&[value]>=0.75&&[value]<1&&MAX('Table'[Year]) in _selectyear,1,0)4. Place [Flag]in Filters, set is=1, apply filter.
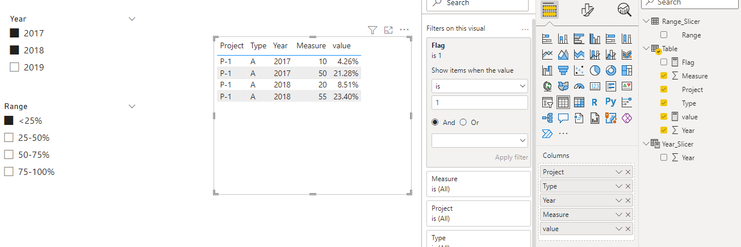
5. Result:
If you need pbix, please click here.
Best Regards,
Liu Yang
If this post helps, then please consider Accept it as the solution to help the other members find it more quickly
- Mark as New
- Bookmark
- Subscribe
- Mute
- Subscribe to RSS Feed
- Permalink
- Report Inappropriate Content
Hi @Anonymous ,
Thanks for the response.
Here are few things which is required as a part of solution.
1. When I am not selecting any values in either YEAR and Range filter, nothing comes up as shown below, ideally it will suppose to display complete set of data , please suggest
2. When I am selecting multiple Year say 2017 and 2018,VALUE need to be calculated based on VALUE/(sum of VALUE of that year), i.e. if there is value in 2017 year, it will be calculated as VALUE/[sum(VALUE) of 2017], and for YEAR 2018, it must be VALUE/SUM(VALUE) of 2018.
However, it works well when I am selecting only ONE YEAR say 2017 in Year Filter, but it doesn't works well as soon as i will select another year say 2018 alongwith 2017, it shows incorrect values, as shown below.
i.e. In first snapshot-1, where only year selected is 2017, it shows value as 6.25% which is correct however in snapshot-2, I have selected 2017 and 2018. value shown as 4.25% which is incorrect, it suppose to 6.25$ only, please suggest!!
Please assist and suggest!!
Thanks
Amit
Helpful resources

Power BI Dataviz World Championships
The Power BI Data Visualization World Championships is back! Get ahead of the game and start preparing now!

| User | Count |
|---|---|
| 39 | |
| 37 | |
| 33 | |
| 32 | |
| 29 |
| User | Count |
|---|---|
| 133 | |
| 88 | |
| 85 | |
| 68 | |
| 64 |


