FabCon is coming to Atlanta
Join us at FabCon Atlanta from March 16 - 20, 2026, for the ultimate Fabric, Power BI, AI and SQL community-led event. Save $200 with code FABCOMM.
Register now!- Power BI forums
- Get Help with Power BI
- Desktop
- Service
- Report Server
- Power Query
- Mobile Apps
- Developer
- DAX Commands and Tips
- Custom Visuals Development Discussion
- Health and Life Sciences
- Power BI Spanish forums
- Translated Spanish Desktop
- Training and Consulting
- Instructor Led Training
- Dashboard in a Day for Women, by Women
- Galleries
- Data Stories Gallery
- Themes Gallery
- Contests Gallery
- QuickViz Gallery
- Quick Measures Gallery
- Visual Calculations Gallery
- Notebook Gallery
- Translytical Task Flow Gallery
- TMDL Gallery
- R Script Showcase
- Webinars and Video Gallery
- Ideas
- Custom Visuals Ideas (read-only)
- Issues
- Issues
- Events
- Upcoming Events
The Power BI Data Visualization World Championships is back! Get ahead of the game and start preparing now! Learn more
- Power BI forums
- Forums
- Get Help with Power BI
- Desktop
- Fill in Missing Dates
- Subscribe to RSS Feed
- Mark Topic as New
- Mark Topic as Read
- Float this Topic for Current User
- Bookmark
- Subscribe
- Printer Friendly Page
- Mark as New
- Bookmark
- Subscribe
- Mute
- Subscribe to RSS Feed
- Permalink
- Report Inappropriate Content
Fill in Missing Dates
I have a table of weekly values that I want to break out into daily values.
Data is similar to below but is in Excel.
CREATE TABLE #tempTable (
Brand VARCHAR(100),
Date DATE,
Spend int)

INSERT INTO #tempTable
(
    Brand,
    Date,
    Spend
)
VALUES
('A', '1/7/2021', 100),
('A',  '1/14/2021', 150),
('A', '1/21/2021', 200),
('B', '1/7/2021', 250),
('B', '1/14/2021', 200),
('B', '1/21/2021', 900),
('C', '1/7/2021', 200),
('C', '1/14/2021', 100),
('C', '1/21/2021', 50)

SELECT
	*
FROM #tempTable
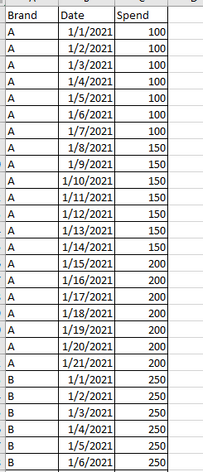
I want to generate records for every day in between the available dates for each Brand so that the end result looks like this:
I found this suggestion on in an old StackOverflow post, but it only works to create a table with just Date and Spend.
FullTable =
ADDCOLUMNS(
    CALENDAR(MIN(#tempTable[Date]), MAX(#tempTable[Date])),
    "Quantity",
    LOOKUPVALUE(
        #tempTable[Spend],
        #tempTable[Date],
        MAXX(
            FILTER(#tempTable, #tempTable[Date] <= EARLIER([Date])),
            [Date]
        )
    )
)
Does anyone have any idea how to expand it to include an additional dimension?
Solved! Go to Solution.
- Mark as New
- Bookmark
- Subscribe
- Mute
- Subscribe to RSS Feed
- Permalink
- Report Inappropriate Content
let
    Source = #table({"Brand","Date","Spend"},{
        {"A", "1/7/2021", 100},
        {"A",  "1/14/2021", 150},
        {"A", "1/21/2021", 200},
        {"B", "1/7/2021", 250},
        {"B", "1/14/2021", 200},
        {"B", "1/21/2021", 900},
        {"C", "1/7/2021", 200},
        {"C", "1/14/2021", 100},
        {"C", "1/21/2021", 50}}),
    #"Changed Type" = Table.TransformColumnTypes(Source,{{"Date", type date}}),
    #"Transformed Column" = Table.TransformColumns(#"Changed Type", {"Date", each List.Reverse(List.Dates(_,7,-#duration(1,0,0,0)))}),
    #"Expanded Date" = Table.ExpandListColumn(#"Transformed Column", "Date")
in
    #"Expanded Date"
Expansion_DAX =
GENERATE (
    Base,
    ADDCOLUMNS ( GENERATESERIES ( 0, 6 ), "All Date", Base[Date] - [Value] )
)
| Thanks to the great efforts by MS engineers to simplify syntax of DAX! Most beginners are SUCCESSFULLY MISLED to think that they could easily master DAX; but it turns out that the intricacy of the most frequently used RANKX() is still way beyond their comprehension! |
DAX is simple, but NOT EASY! |
- Mark as New
- Bookmark
- Subscribe
- Mute
- Subscribe to RSS Feed
- Permalink
- Report Inappropriate Content
The DAX example was exactly what I needed. Though one of the dates did get duplicated, but I'll find a way around that.
Thanks!
Helpful resources

Power BI Dataviz World Championships
The Power BI Data Visualization World Championships is back! Get ahead of the game and start preparing now!

| User | Count |
|---|---|
| 38 | |
| 37 | |
| 33 | |
| 32 | |
| 29 |
| User | Count |
|---|---|
| 132 | |
| 88 | |
| 82 | |
| 68 | |
| 64 |


