Fabric Data Days starts November 4th!
Advance your Data & AI career with 50 days of live learning, dataviz contests, hands-on challenges, study groups & certifications and more!
Get registered- Power BI forums
- Get Help with Power BI
- Desktop
- Service
- Report Server
- Power Query
- Mobile Apps
- Developer
- DAX Commands and Tips
- Custom Visuals Development Discussion
- Health and Life Sciences
- Power BI Spanish forums
- Translated Spanish Desktop
- Training and Consulting
- Instructor Led Training
- Dashboard in a Day for Women, by Women
- Galleries
- Data Stories Gallery
- Themes Gallery
- Contests Gallery
- QuickViz Gallery
- Quick Measures Gallery
- Visual Calculations Gallery
- Notebook Gallery
- Translytical Task Flow Gallery
- TMDL Gallery
- R Script Showcase
- Webinars and Video Gallery
- Ideas
- Custom Visuals Ideas (read-only)
- Issues
- Issues
- Events
- Upcoming Events
Get Fabric Certified for FREE during Fabric Data Days. Don't miss your chance! Request now
- Power BI forums
- Forums
- Get Help with Power BI
- Desktop
- Dynamically Change a dataset based on a filter
- Subscribe to RSS Feed
- Mark Topic as New
- Mark Topic as Read
- Float this Topic for Current User
- Bookmark
- Subscribe
- Printer Friendly Page
- Mark as New
- Bookmark
- Subscribe
- Mute
- Subscribe to RSS Feed
- Permalink
- Report Inappropriate Content
Dynamically Change a dataset based on a filter
Hello, I am almost sure this is not possible, but I am hoping that there is a workaround.
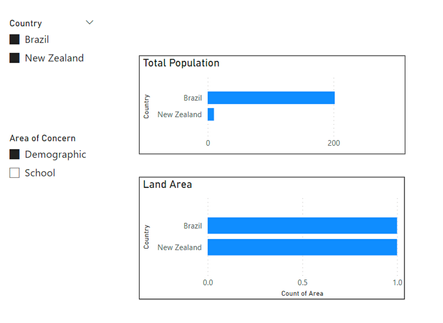
I have four datasets in two areas of concern: two datasets (Math Grades and English Grades) are about School and two are about demographic (Total Population and Land Area).
Goal: When I select "area of concern = School, then the charts Math Grades and English Grades appear", if I select "area of concern = demographic, then charts Total Population and Land Area appear" as in the image below:
Then if a select another area of concern, the charts change:
I tried to create another Table in Power BI to be used as Referece Table like this one below:
Then, I tried to link them on the "Model View" like the image below but it didn't work at all.
Has Anyone done something similar? Observation: the actual datasets have thousands of rows, so I cannot append all the datasets in one single dataset. They have to be separated.
Best regards
Solved! Go to Solution.
- Mark as New
- Bookmark
- Subscribe
- Mute
- Subscribe to RSS Feed
- Permalink
- Report Inappropriate Content
Hi @Anonymous ,
This is possible, please check this model.
This requires creating an unconnected table for the slicer and switching measure based on the slicer's selected values.
Best Regards,
Gao
Community Support Team
If there is any post helps, then please consider Accept it as the solution to help the other members find it more quickly. If I misunderstand your needs or you still have problems on it, please feel free to let us know. Thanks a lot!
How to get your questions answered quickly -- How to provide sample data in the Power BI Forum
- Mark as New
- Bookmark
- Subscribe
- Mute
- Subscribe to RSS Feed
- Permalink
- Report Inappropriate Content
Hello @Anonymous ,
Thank you very much! That helped a lot! I see, the tables are linked becaused of the measure now! So, not necessary to connect the tables. And the "measure" goes into the "values" area. Got it!
Knowing that's possible, I wonder what would happen if I had 20 categories not equally split into these two areas of concern. I'll apply your idea on hypothetical scenarios to see what I can achieve.
Thank you!
Kind regards,
Lucianna
Helpful resources

Fabric Data Days
Advance your Data & AI career with 50 days of live learning, contests, hands-on challenges, study groups & certifications and more!

Power BI Monthly Update - October 2025
Check out the October 2025 Power BI update to learn about new features.


