cancel
Showing results for 
Search instead for 
Did you mean: 

July 28 - August 9 | Final Round of the Power BI Dataviz World Championships. This is your chance. Learn more

Reply
Anonymous
Not applicable

Dollar Ranges

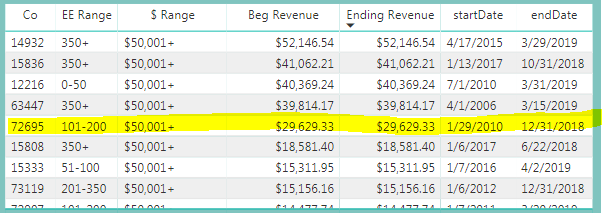
So I'm not sure if this is possible, but is there any way to make a column be dynamic?? What I know my users are looking for is the ability to set date ranges themselves and have people categorized based on the date range they've selected. So below this is looking at a date range of 4/16/18-4/16/19:


1111.PNG


So the measure 'Beg Revenue' calculates dynamically based on the date range selected. So looking at the highlighted row, we see the revenue is ~$29,000, but the '$ Range' column is returning a range of $50,001+ which isn't correct. It's not correct because the company by default is being categorized based on the TOTAL amount of revenue it has in the revenue table and not what the company made between 4/16/18-4/16/19. 


This is tricky to pull off because I was aiming to build something like this:

1.PNG  

So the highlighted company in the first screenshot would be placed in the far right column when it should be placed in the 15,001-50,000 column.


I know I can build this column into a measure that does calculate dynamically, but I know measures cannot be placed on a matrix like this for viewing, so I feel stuck. Any suggestions?


2 REPLIES 2
v-yuta-msft
Community Support
Community Support

@Anonymous ,


I'm afraid power bi doesn't support dynamic calculate column as you required. You need to use a measure instead, you can drag the measure to values field of the matrix visual.


Community Support Team _ Jimmy Tao

If this post helps, then please consider Accept it as the solution to help the other members find it more quickly.

Anonymous
Not applicable

@v-yuta-msft Is it possible to create a column based on the sum of revenue they made in a particular year? Like pulling in a few years of revenue, but placing them into categories based on the amount of revenue they made in 2018. All companies make roughly the same amount of money each year, so I'm sure that would suffice. Currently the ranges are being decided based on all revenue from the past few years. So if from 2016-Today a company made a total of $70,000 the table is placing them in the $50,001+ category which isn't what I want. If I could figure out how to bucket them into a single year of revenue, that would work. 

Helpful resources

Announcements
FabCon and SQLCon Barcelona 2026

FabCon & SQLCon – Barcelona 2026

Join us in Barcelona for FabCon and SQLCon, the Fabric, Power BI, SQL, and AI community event. Save €200 with code FABCMTY200.

Fabric Community Sticker Design Challenge Barcelona Carousel

Fabric Community Sticker Challenge - Barcelona 2026

If you love stickers, then you will definitely want to check out our community sticker challenge, Barcelona edition!

July Power BI Update Carousel

Power BI Monthly Update - July 2026

Check out the July 2026 Power BI update to learn about new features.

Power BI DataViz World Championships carousel

Power BI DataViz World Championships - June 2026

A new Power BI DataViz World Championship is coming this June! Don't miss out on submitting your entry.

Top Solution Authors