New Offer! Become a Certified Fabric Data Engineer
Check your eligibility for this 50% exam voucher offer and join us for free live learning sessions to get prepared for Exam DP-700.
Get Started- Power BI forums
- Get Help with Power BI
- Desktop
- Service
- Report Server
- Power Query
- Mobile Apps
- Developer
- DAX Commands and Tips
- Custom Visuals Development Discussion
- Health and Life Sciences
- Power BI Spanish forums
- Translated Spanish Desktop
- Training and Consulting
- Instructor Led Training
- Dashboard in a Day for Women, by Women
- Galleries
- Community Connections & How-To Videos
- COVID-19 Data Stories Gallery
- Themes Gallery
- Data Stories Gallery
- R Script Showcase
- Webinars and Video Gallery
- Quick Measures Gallery
- 2021 MSBizAppsSummit Gallery
- 2020 MSBizAppsSummit Gallery
- 2019 MSBizAppsSummit Gallery
- Events
- Ideas
- Custom Visuals Ideas
- Issues
- Issues
- Events
- Upcoming Events
Don't miss out! 2025 Microsoft Fabric Community Conference, March 31 - April 2, Las Vegas, Nevada. Use code MSCUST for a $150 discount. Prices go up February 11th. Register now.
- Power BI forums
- Forums
- Get Help with Power BI
- Desktop
- Dividing a column by a specific row to find the pe...
- Subscribe to RSS Feed
- Mark Topic as New
- Mark Topic as Read
- Float this Topic for Current User
- Bookmark
- Subscribe
- Printer Friendly Page
- Mark as New
- Bookmark
- Subscribe
- Mute
- Subscribe to RSS Feed
- Permalink
- Report Inappropriate Content
Dividing a column by a specific row to find the percentage.
Hello.
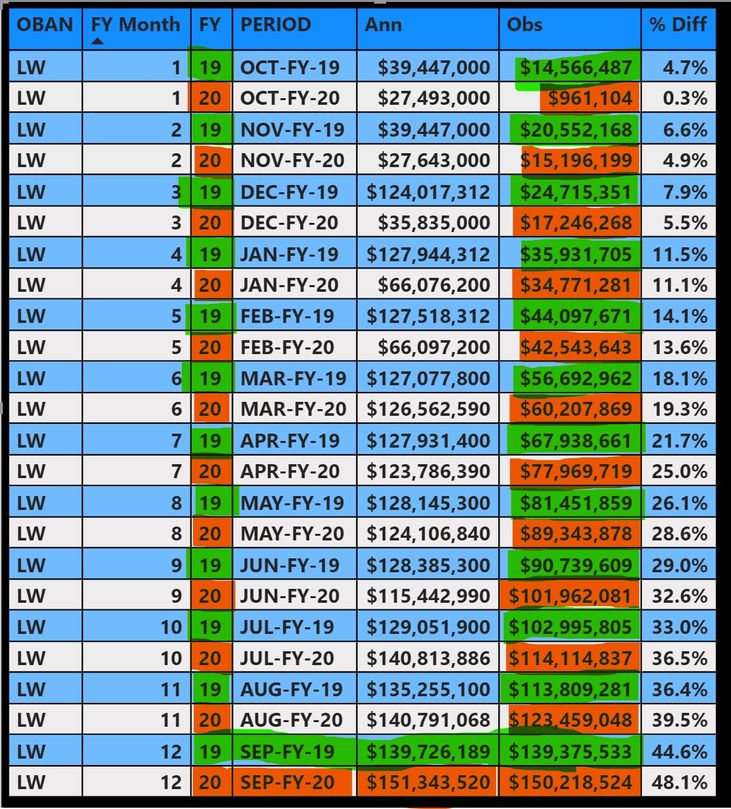
I have a table of historical data for the past couple of fiscal years. I am trying to divide one column [Obs], by the value on the last month of the year in a different column [Ann].
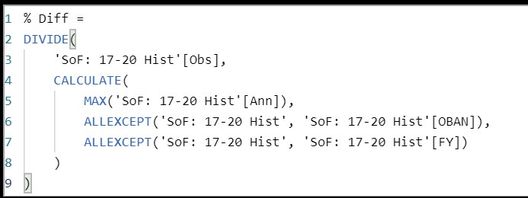
I tried the following:
The Table looks like this:
I am trying to DIVIDE the green [Obs] by the green [Ann] for each month. And Divide the red [Obs] by the red [Ann] for each month. Here, in yellow, is what I am looking for:
Here it is again in order by date so you can see the percantage increase each month:
Thanks.
Solved! Go to Solution.
- Mark as New
- Bookmark
- Subscribe
- Mute
- Subscribe to RSS Feed
- Permalink
- Report Inappropriate Content
Hi,
You may download my PBI file from here.
Hope this helps.
Regards,
Ashish Mathur
http://www.ashishmathur.com
https://www.linkedin.com/in/excelenthusiasts/
- Mark as New
- Bookmark
- Subscribe
- Mute
- Subscribe to RSS Feed
- Permalink
- Report Inappropriate Content
Hi,
Do you want a calculated column or a measure solution? Share your MS Excel file with your formula so that i can translate that into the DAX language.
Regards,
Ashish Mathur
http://www.ashishmathur.com
https://www.linkedin.com/in/excelenthusiasts/
- Mark as New
- Bookmark
- Subscribe
- Mute
- Subscribe to RSS Feed
- Permalink
- Report Inappropriate Content
A measure would likely be better. It is to put into a line graph showing the % by the month. The below is not correct, the % Diff should be 0-100% and the months on the X axis will show by month, not number:
Here is the sample file link:
https://drive.google.com/file/d/1p_Z6UziWgvyYF_iAaQziI_8Ymv2Rbo2Z/view?usp=sharing
Thanks
- Mark as New
- Bookmark
- Subscribe
- Mute
- Subscribe to RSS Feed
- Permalink
- Report Inappropriate Content
Hi,
Please clarify the following:
- The Fincnial Year runs from October to September; and
- Cell W2 in the Excel file is actually October 2019 and W13 is September 2020
Is my understanding correct?
Regards,
Ashish Mathur
http://www.ashishmathur.com
https://www.linkedin.com/in/excelenthusiasts/
- Mark as New
- Bookmark
- Subscribe
- Mute
- Subscribe to RSS Feed
- Permalink
- Report Inappropriate Content
Correct. The Fiscal Year Starts in October and Ends in September. So Fiscal Year 2020 Started on October 1, 2019 and ended Sepember 30, 2020.
- Mark as New
- Bookmark
- Subscribe
- Mute
- Subscribe to RSS Feed
- Permalink
- Report Inappropriate Content
Hi,
You may download my PBI file from here.
Hope this helps.
Regards,
Ashish Mathur
http://www.ashishmathur.com
https://www.linkedin.com/in/excelenthusiasts/
- Mark as New
- Bookmark
- Subscribe
- Mute
- Subscribe to RSS Feed
- Permalink
- Report Inappropriate Content
Thank you very much. This has taken me days.
- Mark as New
- Bookmark
- Subscribe
- Mute
- Subscribe to RSS Feed
- Permalink
- Report Inappropriate Content
You are welcome.
Regards,
Ashish Mathur
http://www.ashishmathur.com
https://www.linkedin.com/in/excelenthusiasts/
Helpful resources

Join us at the Microsoft Fabric Community Conference
March 31 - April 2, 2025, in Las Vegas, Nevada. Use code MSCUST for a $150 discount! Prices go up Feb. 11th.

Power BI Monthly Update - January 2025
Check out the January 2025 Power BI update to learn about new features in Reporting, Modeling, and Data Connectivity.

| User | Count |
|---|---|
| 128 | |
| 76 | |
| 55 | |
| 41 | |
| 40 |
| User | Count |
|---|---|
| 206 | |
| 83 | |
| 72 | |
| 56 | |
| 51 |


