Join us at FabCon Vienna from September 15-18, 2025
The ultimate Fabric, Power BI, SQL, and AI community-led learning event. Save €200 with code FABCOMM.
Get registered- Power BI forums
- Get Help with Power BI
- Desktop
- Service
- Report Server
- Power Query
- Mobile Apps
- Developer
- DAX Commands and Tips
- Custom Visuals Development Discussion
- Health and Life Sciences
- Power BI Spanish forums
- Translated Spanish Desktop
- Training and Consulting
- Instructor Led Training
- Dashboard in a Day for Women, by Women
- Galleries
- Data Stories Gallery
- Themes Gallery
- Contests Gallery
- Quick Measures Gallery
- Notebook Gallery
- Translytical Task Flow Gallery
- TMDL Gallery
- R Script Showcase
- Webinars and Video Gallery
- Ideas
- Custom Visuals Ideas (read-only)
- Issues
- Issues
- Events
- Upcoming Events
Compete to become Power BI Data Viz World Champion! First round ends August 18th. Get started.
- Power BI forums
- Forums
- Get Help with Power BI
- Desktop
- Divide numbers from different dates
- Subscribe to RSS Feed
- Mark Topic as New
- Mark Topic as Read
- Float this Topic for Current User
- Bookmark
- Subscribe
- Printer Friendly Page
- Mark as New
- Bookmark
- Subscribe
- Mute
- Subscribe to RSS Feed
- Permalink
- Report Inappropriate Content
Divide numbers from different dates
Hello,
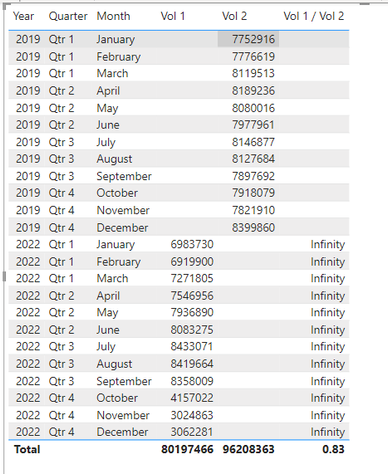
I would like to have one measure which divides Vol 1 numbers by Vol 2 numbers in the same month periods.
Do you know how to create such a mesure? Tried already with calculate but couldn't solve that.
Thanks
Solved! Go to Solution.
- Mark as New
- Bookmark
- Subscribe
- Mute
- Subscribe to RSS Feed
- Permalink
- Report Inappropriate Content
@Anonymous , With help from a date table, joined with your date of table/s and date tbale columns used on axis/slicer etc
use trailing measure
3 Year behind Sales = CALCULATE(SUM(Sales[Sales Amount]),dateadd('Date'[Date],-3,Year))
Time Intelligence, DATESMTD, DATESQTD, DATESYTD, Week On Week, Week Till Date, Custom Period on Period,
Custom Period till date: https://youtu.be/aU2aKbnHuWs&t=145s
- Mark as New
- Bookmark
- Subscribe
- Mute
- Subscribe to RSS Feed
- Permalink
- Report Inappropriate Content
Ok, I solved that.
Added additional column in calander table: DATEDIFF(Z_Calendar[Date],01/01/2019,YEAR)
And then replaced "-3" with SUM(Z_Calendar[Datediff covid])
- Mark as New
- Bookmark
- Subscribe
- Mute
- Subscribe to RSS Feed
- Permalink
- Report Inappropriate Content
- Mark as New
- Bookmark
- Subscribe
- Mute
- Subscribe to RSS Feed
- Permalink
- Report Inappropriate Content
Thanks @amitchandak for the answer. It works but actualy my final goal is to have a chart like below where I have to show year 2022. Vol 1 / Vol 2 = infinity so I think it is necessary to solve that inside a measure.
- Mark as New
- Bookmark
- Subscribe
- Mute
- Subscribe to RSS Feed
- Permalink
- Report Inappropriate Content
@amitchandak
On the screenshot there is only 2022 but I have also forcast data for 2023 which I have to show on the chart so can't remove a year.
- Mark as New
- Bookmark
- Subscribe
- Mute
- Subscribe to RSS Feed
- Permalink
- Report Inappropriate Content
@Anonymous , With help from a date table, joined with your date of table/s and date tbale columns used on axis/slicer etc
use trailing measure
3 Year behind Sales = CALCULATE(SUM(Sales[Sales Amount]),dateadd('Date'[Date],-3,Year))
Time Intelligence, DATESMTD, DATESQTD, DATESYTD, Week On Week, Week Till Date, Custom Period on Period,
Custom Period till date: https://youtu.be/aU2aKbnHuWs&t=145s
- Mark as New
- Bookmark
- Subscribe
- Mute
- Subscribe to RSS Feed
- Permalink
- Report Inappropriate Content
@amitchandak thank you for your help! Just one additional question. Do you know if it is possible to make "-3" from the formula dynamic? Because for 2022 it shows data for 2019 but for 2023 it shows 2020 but I also need 2019.
- Mark as New
- Bookmark
- Subscribe
- Mute
- Subscribe to RSS Feed
- Permalink
- Report Inappropriate Content
Ok, I solved that.
Added additional column in calander table: DATEDIFF(Z_Calendar[Date],01/01/2019,YEAR)
And then replaced "-3" with SUM(Z_Calendar[Datediff covid])


