FabCon is coming to Atlanta
Join us at FabCon Atlanta from March 16 - 20, 2026, for the ultimate Fabric, Power BI, AI and SQL community-led event. Save $200 with code FABCOMM.
Register now!- Power BI forums
- Get Help with Power BI
- Desktop
- Service
- Report Server
- Power Query
- Mobile Apps
- Developer
- DAX Commands and Tips
- Custom Visuals Development Discussion
- Health and Life Sciences
- Power BI Spanish forums
- Translated Spanish Desktop
- Training and Consulting
- Instructor Led Training
- Dashboard in a Day for Women, by Women
- Galleries
- Data Stories Gallery
- Themes Gallery
- Contests Gallery
- Quick Measures Gallery
- Visual Calculations Gallery
- Notebook Gallery
- Translytical Task Flow Gallery
- TMDL Gallery
- R Script Showcase
- Webinars and Video Gallery
- Ideas
- Custom Visuals Ideas (read-only)
- Issues
- Issues
- Events
- Upcoming Events
Calling all Data Engineers! Fabric Data Engineer (Exam DP-700) live sessions are back! Starting October 16th. Sign up.
- Power BI forums
- Forums
- Get Help with Power BI
- Desktop
- DateTimeTable not showing on x-axis for NULL measu...
- Subscribe to RSS Feed
- Mark Topic as New
- Mark Topic as Read
- Float this Topic for Current User
- Bookmark
- Subscribe
- Printer Friendly Page
- Mark as New
- Bookmark
- Subscribe
- Mute
- Subscribe to RSS Feed
- Permalink
- Report Inappropriate Content
DateTimeTable not showing on x-axis for NULL measures? (How to show periods with no data)
Hello,
I have a PBI report where I am measuring samples hourly. In this case, visitors to the website, registered memebers vs guests.
I found that when I try to graph periods of NO visitors/count = NULL that it becomes difficult to show that.
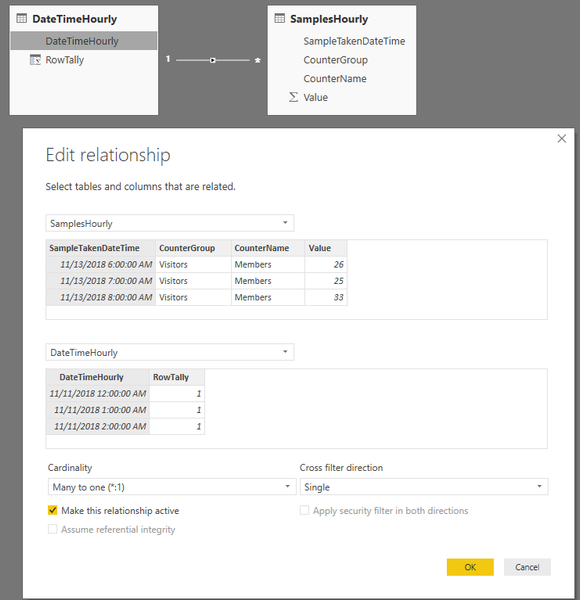
I have two tables: DateTimeHourly that has one entry for each hour of each calendar day and another SamplesHourly that ONLY gets a row added if a sample was collected/recorded that hour.
Here is what see:
Then if I add a simple measure on the DateTime table to show a 1 for each row of the DateTimeHourly table which is my date dimension (one row per hour)
How can I achieve that without having to add a "Tally" measure? I would have thought using Show Items With No Data would accomplish that, but it had no impact.
It seems like I should be able to see all the times that no data was collected over the X-axis?
I am using a datetime table so there is 1 row for every hour, as opposed to not doing there where I could understand that it may not show entries if there is nothing in the system for hours before or after a certain time.
I can upload my PBIX file..if someone tells me how to do that. I don't see the normal upload options anymore.
Here is what happens though:
When I try to use the Sparkline custom visual (or any similar one) it appears as if all data is accounted for, however, as we can see there are large sections of the x-axis where NO data was recorded. I want to show that as line breaks so the user doesn't think everything was all good and proper when it was not.
- Mark as New
- Bookmark
- Subscribe
- Mute
- Subscribe to RSS Feed
- Permalink
- Report Inappropriate Content
Hi @OneWithQuestion ,
Can you upload your pbix on google / One Drive and share the link here. Also share the final output expected given the data.
Cheers
CheenuSing
Helpful resources

FabCon Global Hackathon
Join the Fabric FabCon Global Hackathon—running virtually through Nov 3. Open to all skill levels. $10,000 in prizes!

Power BI Monthly Update - October 2025
Check out the October 2025 Power BI update to learn about new features.


