Fabric Data Days starts November 4th!
Advance your Data & AI career with 50 days of live learning, dataviz contests, hands-on challenges, study groups & certifications and more!
Get registered- Power BI forums
- Get Help with Power BI
- Desktop
- Service
- Report Server
- Power Query
- Mobile Apps
- Developer
- DAX Commands and Tips
- Custom Visuals Development Discussion
- Health and Life Sciences
- Power BI Spanish forums
- Translated Spanish Desktop
- Training and Consulting
- Instructor Led Training
- Dashboard in a Day for Women, by Women
- Galleries
- Data Stories Gallery
- Themes Gallery
- Contests Gallery
- QuickViz Gallery
- Quick Measures Gallery
- Visual Calculations Gallery
- Notebook Gallery
- Translytical Task Flow Gallery
- TMDL Gallery
- R Script Showcase
- Webinars and Video Gallery
- Ideas
- Custom Visuals Ideas (read-only)
- Issues
- Issues
- Events
- Upcoming Events
Get Fabric Certified for FREE during Fabric Data Days. Don't miss your chance! Request now
- Power BI forums
- Forums
- Get Help with Power BI
- Desktop
- Date selector showing values that don't exist
- Subscribe to RSS Feed
- Mark Topic as New
- Mark Topic as Read
- Float this Topic for Current User
- Bookmark
- Subscribe
- Printer Friendly Page
- Mark as New
- Bookmark
- Subscribe
- Mute
- Subscribe to RSS Feed
- Permalink
- Report Inappropriate Content
Date selector showing values that don't exist
Hi,
I have a table, along with a date slicer that the business user can select:
- Fiscal Year
- Fiscal Year Week - usually there are 52 weeks in a year.
- She wants a range finder (not a dropdown), like the one I show below.
When multiple year's are selected, the fiscal week slicer starts showing weeks that don't exist in the data set. How can I get it to show just the fiscal weeks that are in the dataset?
- Here I have just 2020 selected, and it gives me from 202001 to 202052
- When I select both 2020 and 2021, it's giving me values like 202093 (which there is no data for)
Thanks so much!
- Mark as New
- Bookmark
- Subscribe
- Mute
- Subscribe to RSS Feed
- Permalink
- Report Inappropriate Content
+1 Got the same problem with YearMonth key. 202384 is not a number that exists in the table
- Mark as New
- Bookmark
- Subscribe
- Mute
- Subscribe to RSS Feed
- Permalink
- Report Inappropriate Content
Any help on this one, would be much appreciated. Wondering if there's any other ideas.
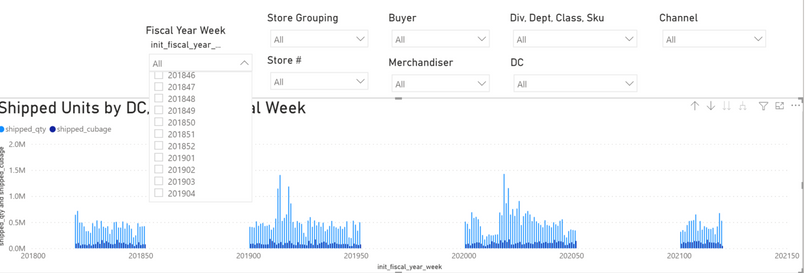
When I pick dates in the same fiscal year. 202101 to 202120, the visual looks good.
When I pick dates that span multiple years like 202001 to 202120, I get these blank values showing up.
All the data is coming from just one table, and there are no values between 202052 and 202101 in the dataset.
When I use the dropdown, I don't see the extra date values in the slicer, but do in the visual.
It seems like the fiscal year week's go up to 99. E.g. 202099
When I click on the slider, the extra dates do show up in the slider.
Thanks,
- Mark as New
- Bookmark
- Subscribe
- Mute
- Subscribe to RSS Feed
- Permalink
- Report Inappropriate Content
Hi, @Anonymous
Not very clear about the structure of your table, the following is a reference may be helpful
https://blog.crossjoin.co.uk/2019/07/10/power-bi-slicers-show-values-that-do-not-exist/
Hope this helps.
Best Regards,
Community Support Team _ Zeon Zheng
If this post helps, then please consider Accept it as the solution to help the other members find it more quickly.
- Mark as New
- Bookmark
- Subscribe
- Mute
- Subscribe to RSS Feed
- Permalink
- Report Inappropriate Content
- Mark as New
- Bookmark
- Subscribe
- Mute
- Subscribe to RSS Feed
- Permalink
- Report Inappropriate Content
Hey @amitchandak !
There aren't any values of such. It does seem super strange.
Goes from week 52 of 2019 to week 1 of 2020 for example.
Helpful resources

Fabric Data Days
Advance your Data & AI career with 50 days of live learning, contests, hands-on challenges, study groups & certifications and more!

Power BI Monthly Update - October 2025
Check out the October 2025 Power BI update to learn about new features.


