FabCon is coming to Atlanta
Join us at FabCon Atlanta from March 16 - 20, 2026, for the ultimate Fabric, Power BI, AI and SQL community-led event. Save $200 with code FABCOMM.
Register now!- Power BI forums
- Get Help with Power BI
- Desktop
- Service
- Report Server
- Power Query
- Mobile Apps
- Developer
- DAX Commands and Tips
- Custom Visuals Development Discussion
- Health and Life Sciences
- Power BI Spanish forums
- Translated Spanish Desktop
- Training and Consulting
- Instructor Led Training
- Dashboard in a Day for Women, by Women
- Galleries
- Data Stories Gallery
- Themes Gallery
- Contests Gallery
- QuickViz Gallery
- Quick Measures Gallery
- Visual Calculations Gallery
- Notebook Gallery
- Translytical Task Flow Gallery
- TMDL Gallery
- R Script Showcase
- Webinars and Video Gallery
- Ideas
- Custom Visuals Ideas (read-only)
- Issues
- Issues
- Events
- Upcoming Events
The Power BI Data Visualization World Championships is back! Get ahead of the game and start preparing now! Learn more
- Power BI forums
- Forums
- Get Help with Power BI
- Desktop
- DAX to dynamically change the currency symbol faci...
- Subscribe to RSS Feed
- Mark Topic as New
- Mark Topic as Read
- Float this Topic for Current User
- Bookmark
- Subscribe
- Printer Friendly Page
- Mark as New
- Bookmark
- Subscribe
- Mute
- Subscribe to RSS Feed
- Permalink
- Report Inappropriate Content
DAX to dynamically change the currency symbol facing issue
Hi,
I am trying to dynamically change the currency symbol according to the currency selection in the slicer.
Below is my DAX:
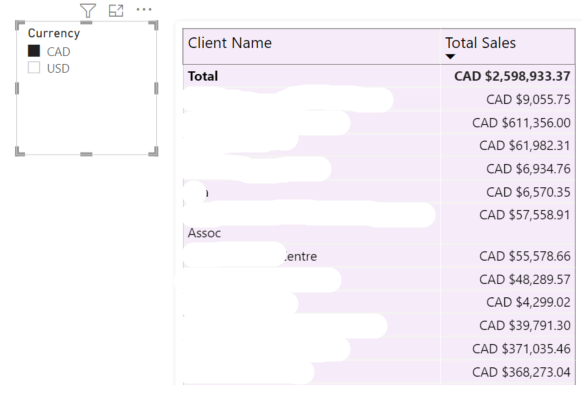
The results are correct as shown below:

But the issue I face is I can neither sort it (descending based on Total Sales)
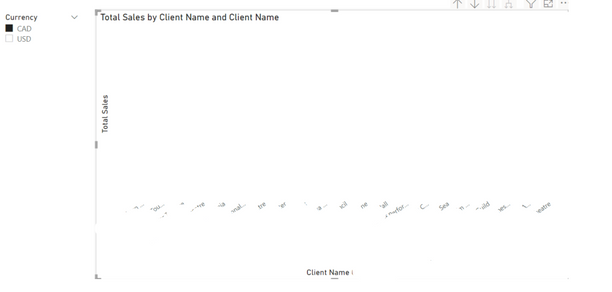
nor can I convert it to a chart as it displays no values for Total Sales

Can you pls help me resolve the issue as to how can I dynamically change the currency symbol according to the currency selection in the slicer and at the same time convert it to a chart and sort the values in a table?
Solved! Go to Solution.
- Mark as New
- Bookmark
- Subscribe
- Mute
- Subscribe to RSS Feed
- Permalink
- Report Inappropriate Content
Hi @Anonymous
I have the problem can't display table, my solution is that add a function IF(HASONEVALUE('Table'[ID]), [GET VALUE], total value). However, total value has some diffcultly to calculate. My idea is sum(fact value) * exchange rate.
Back your case, you need a rate. For example , USD 400 when you select CAD the value 400 need multiply 1.24 =497. so , if create a bar chart , (fact values * rate) be the values of the bar chart is a good idea. format measure you created is better when you create a table.
Sort by string is impossible without any other int column. just like your screenshot, add the value column to sort this table.
Best Regards
Community Support Team _ chenwu zhu
If this post helps, then please consider Accept it as the solution to help the other members find it more quickly.
- Mark as New
- Bookmark
- Subscribe
- Mute
- Subscribe to RSS Feed
- Permalink
- Report Inappropriate Content
Hi @Anonymous,
For short ,the problem is that the measure result is string instead of int, so it is blank().
In the bar chart values, you should use a measure to get the value of Total Sales Converted, some measure like the following:
GET VALUE =
VALUE(RIGHT([Total Sales Converted],LEN([Total Sales Converted])-4)) // 4 is the length of "USA" and "$"
Change above measure in your case and I put my pbix you can refer.
Best Regards
Community Support Team _ chenwu zhu
If this post helps, then please consider Accept it as the solution to help the other members find it more quickly.
- Mark as New
- Bookmark
- Subscribe
- Mute
- Subscribe to RSS Feed
- Permalink
- Report Inappropriate Content
Hi @v-chenwuz-msft,
Thank you for replying,
I did my testing and I believe this solution works if I have values like CAD$400 and USD$400. But in my case, I simply have $400 for the US Values and £400 for the British (GBP) Values.
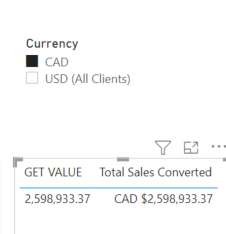
Another issue I see is even if I resolve the above problem, the new calculated measure "GET VALUE" gives me an error when I try to add Client name or Client Id as shown below:
when I add Client Id/ Client Name which is from separate table "Client", the table shows an error
Can you pls help me resolve this?
Lastly, Can you also give me a workaround for sorting the values in a table but with the formatted currency?
as shown in the below screenshot?
- Mark as New
- Bookmark
- Subscribe
- Mute
- Subscribe to RSS Feed
- Permalink
- Report Inappropriate Content
Hi @Anonymous
I have the problem can't display table, my solution is that add a function IF(HASONEVALUE('Table'[ID]), [GET VALUE], total value). However, total value has some diffcultly to calculate. My idea is sum(fact value) * exchange rate.
Back your case, you need a rate. For example , USD 400 when you select CAD the value 400 need multiply 1.24 =497. so , if create a bar chart , (fact values * rate) be the values of the bar chart is a good idea. format measure you created is better when you create a table.
Sort by string is impossible without any other int column. just like your screenshot, add the value column to sort this table.
Best Regards
Community Support Team _ chenwu zhu
If this post helps, then please consider Accept it as the solution to help the other members find it more quickly.
Helpful resources

Power BI Monthly Update - November 2025
Check out the November 2025 Power BI update to learn about new features.

Fabric Data Days
Advance your Data & AI career with 50 days of live learning, contests, hands-on challenges, study groups & certifications and more!

| User | Count |
|---|---|
| 58 | |
| 45 | |
| 40 | |
| 21 | |
| 18 |


