- Power BI forums
- Updates
- News & Announcements
- Get Help with Power BI
- Desktop
- Service
- Report Server
- Power Query
- Mobile Apps
- Developer
- DAX Commands and Tips
- Custom Visuals Development Discussion
- Health and Life Sciences
- Power BI Spanish forums
- Translated Spanish Desktop
- Power Platform Integration - Better Together!
- Power Platform Integrations (Read-only)
- Power Platform and Dynamics 365 Integrations (Read-only)
- Training and Consulting
- Instructor Led Training
- Dashboard in a Day for Women, by Women
- Galleries
- Community Connections & How-To Videos
- COVID-19 Data Stories Gallery
- Themes Gallery
- Data Stories Gallery
- R Script Showcase
- Webinars and Video Gallery
- Quick Measures Gallery
- 2021 MSBizAppsSummit Gallery
- 2020 MSBizAppsSummit Gallery
- 2019 MSBizAppsSummit Gallery
- Events
- Ideas
- Custom Visuals Ideas
- Issues
- Issues
- Events
- Upcoming Events
- Community Blog
- Power BI Community Blog
- Custom Visuals Community Blog
- Community Support
- Community Accounts & Registration
- Using the Community
- Community Feedback
Register now to learn Fabric in free live sessions led by the best Microsoft experts. From Apr 16 to May 9, in English and Spanish.
- Power BI forums
- Forums
- Get Help with Power BI
- Desktop
- Re: DAX formula for share and contribution calcula...
- Subscribe to RSS Feed
- Mark Topic as New
- Mark Topic as Read
- Float this Topic for Current User
- Bookmark
- Subscribe
- Printer Friendly Page
- Mark as New
- Bookmark
- Subscribe
- Mute
- Subscribe to RSS Feed
- Permalink
- Report Inappropriate Content
DAX formula for share and contribution calculations
Hello Power BI Community,
Happy New Year! 😊 I require help with DAX calculations in Power BI. Please refer the below image. Columns A, B, and C are from the raw data. I require metrics to be calculated as mentioned in columns "D" and "E" with the corresponding expected values in columns "F" and "G", respectively. Please help!
Thanks in advance,
Aditya Nayak
Solved! Go to Solution.
- Mark as New
- Bookmark
- Subscribe
- Mute
- Subscribe to RSS Feed
- Permalink
- Report Inappropriate Content
Hi @AdityaNayak ,
Here are the steps you can follow:
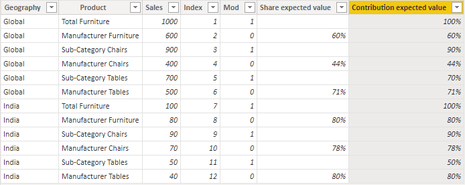
1. In Power query, Add Column – Index Column – From 1.
2. Create calculated column.
Mod = MOD('SumTable'[Index],2)Share expected value =
var _sum1=CALCULATE(SUM('SumTable'[Sales]),FILTER(ALL('SumTable'),'SumTable'[Geography]=EARLIER('SumTable'[Geography])&&'SumTable'[Index]=EARLIER('SumTable'[Index])))
var _sum2=CALCULATE(SUM('SumTable'[Sales]),FILTER(ALL('SumTable'),'SumTable'[Geography]=EARLIER('SumTable'[Geography])&&'SumTable'[Index]=EARLIER('SumTable'[Index])-1))
return
IF(
'SumTable'[Mod]=1,BLANK(),DIVIDE(_sum1,_sum2)
)Contribution expected value =
var _sum1=CALCULATE(SUM('SumTable'[Sales]),FILTER(ALL('SumTable'),'SumTable'[Geography]=EARLIER('SumTable'[Geography])&&'SumTable'[Index]=EARLIER('SumTable'[Index])))
var _min=MINX(FILTER(ALL(SumTable),'SumTable'[Geography]=EARLIER('SumTable'[Geography])),[Index])
var _sum2=CALCULATE(SUM('SumTable'[Sales]),FILTER(ALL('SumTable'),'SumTable'[Geography]=EARLIER('SumTable'[Geography])&&'SumTable'[Index]=_min))
var _sum3=CALCULATE(SUM('SumTable'[Sales]),FILTER(ALL('SumTable'),'SumTable'[Geography]=EARLIER('SumTable'[Geography])&&'SumTable'[Index]=EARLIER('SumTable'[Index])-1))
return
IF(
'SumTable'[Mod]=1,DIVIDE(_sum1,_sum2),DIVIDE(_sum1,_sum3)
)3. Result:
Best Regards,
Liu Yang
If this post helps, then please consider Accept it as the solution to help the other members find it more quickly
- Mark as New
- Bookmark
- Subscribe
- Mute
- Subscribe to RSS Feed
- Permalink
- Report Inappropriate Content
Hi @AdityaNayak ,
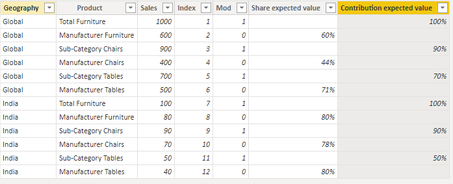
You can change [Contribution expected value] to this:
Contribution expected value =
var _sum1=CALCULATE(SUM('SumTable'[Sales]),FILTER(ALL('SumTable'),'SumTable'[Geography]=EARLIER('SumTable'[Geography])&&'SumTable'[Index]=EARLIER('SumTable'[Index])))
var _min=MINX(FILTER(ALL(SumTable),'SumTable'[Geography]=EARLIER('SumTable'[Geography])),[Index])
var _sum2=CALCULATE(SUM('SumTable'[Sales]),FILTER(ALL('SumTable'),'SumTable'[Geography]=EARLIER('SumTable'[Geography])&&'SumTable'[Index]=_min))
var _sum3=CALCULATE(SUM('SumTable'[Sales]),FILTER(ALL('SumTable'),'SumTable'[Geography]=EARLIER('SumTable'[Geography])&&'SumTable'[Index]=EARLIER('SumTable'[Index])-1))
return
IF(
    'SumTable'[Mod]=1,DIVIDE(_sum1,_sum2),BLANK()
)
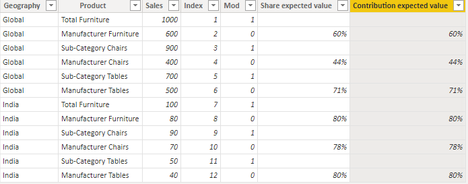
Or this form:
Contribution expected value =
var _sum1=CALCULATE(SUM('SumTable'[Sales]),FILTER(ALL('SumTable'),'SumTable'[Geography]=EARLIER('SumTable'[Geography])&&'SumTable'[Index]=EARLIER('SumTable'[Index])))
var _min=MINX(FILTER(ALL(SumTable),'SumTable'[Geography]=EARLIER('SumTable'[Geography])),[Index])
var _sum2=CALCULATE(SUM('SumTable'[Sales]),FILTER(ALL('SumTable'),'SumTable'[Geography]=EARLIER('SumTable'[Geography])&&'SumTable'[Index]=_min))
var _sum3=CALCULATE(SUM('SumTable'[Sales]),FILTER(ALL('SumTable'),'SumTable'[Geography]=EARLIER('SumTable'[Geography])&&'SumTable'[Index]=EARLIER('SumTable'[Index])-1))
return
IF(
    'SumTable'[Mod]=1,BLANK(),DIVIDE(_sum1,_sum3)
)
Best Regards,
Liu Yang
If this post helps, then please consider Accept it as the solution to help the other members find it more quickly
- Mark as New
- Bookmark
- Subscribe
- Mute
- Subscribe to RSS Feed
- Permalink
- Report Inappropriate Content
- Mark as New
- Bookmark
- Subscribe
- Mute
- Subscribe to RSS Feed
- Permalink
- Report Inappropriate Content
Hi @AdityaNayak ,
Here are the steps you can follow:
1. In Power query, Add Column – Index Column – From 1.
2. Create calculated column.
Mod = MOD('SumTable'[Index],2)Share expected value =
var _sum1=CALCULATE(SUM('SumTable'[Sales]),FILTER(ALL('SumTable'),'SumTable'[Geography]=EARLIER('SumTable'[Geography])&&'SumTable'[Index]=EARLIER('SumTable'[Index])))
var _sum2=CALCULATE(SUM('SumTable'[Sales]),FILTER(ALL('SumTable'),'SumTable'[Geography]=EARLIER('SumTable'[Geography])&&'SumTable'[Index]=EARLIER('SumTable'[Index])-1))
return
IF(
'SumTable'[Mod]=1,BLANK(),DIVIDE(_sum1,_sum2)
)Contribution expected value =
var _sum1=CALCULATE(SUM('SumTable'[Sales]),FILTER(ALL('SumTable'),'SumTable'[Geography]=EARLIER('SumTable'[Geography])&&'SumTable'[Index]=EARLIER('SumTable'[Index])))
var _min=MINX(FILTER(ALL(SumTable),'SumTable'[Geography]=EARLIER('SumTable'[Geography])),[Index])
var _sum2=CALCULATE(SUM('SumTable'[Sales]),FILTER(ALL('SumTable'),'SumTable'[Geography]=EARLIER('SumTable'[Geography])&&'SumTable'[Index]=_min))
var _sum3=CALCULATE(SUM('SumTable'[Sales]),FILTER(ALL('SumTable'),'SumTable'[Geography]=EARLIER('SumTable'[Geography])&&'SumTable'[Index]=EARLIER('SumTable'[Index])-1))
return
IF(
'SumTable'[Mod]=1,DIVIDE(_sum1,_sum2),DIVIDE(_sum1,_sum3)
)3. Result:
Best Regards,
Liu Yang
If this post helps, then please consider Accept it as the solution to help the other members find it more quickly
- Mark as New
- Bookmark
- Subscribe
- Mute
- Subscribe to RSS Feed
- Permalink
- Report Inappropriate Content
Hi @v-yangliu-msft ,
Thanks a lot for this solution! 🙂 It works perfectly for "Share expected value".
One minor change that came up just now, though. I want the corresponding rows of "Contribution expected value" to be blank, as those for "Share expected value".
Regards,
Aditya Nayak
- Mark as New
- Bookmark
- Subscribe
- Mute
- Subscribe to RSS Feed
- Permalink
- Report Inappropriate Content
@AdityaNayak , need to understand data model and raw data
Can you share sample data and sample output in table format? Or a sample pbix after removing sensitive data.
Microsoft Power BI Learning Resources, 2023 !!
Learn Power BI - Full Course with Dec-2022, with Window, Index, Offset, 100+ Topics !!
Did I answer your question? Mark my post as a solution! Appreciate your Kudos !! Proud to be a Super User! !!
- Mark as New
- Bookmark
- Subscribe
- Mute
- Subscribe to RSS Feed
- Permalink
- Report Inappropriate Content
| Geography | Product | Sales | Share formula | Contribution formula | Share expected value | Contribution expected value |
| Global | Total Furniture | 1000 | - | Total Furniture/Total Furniture | - | 100% |
| Global | Manufacturer Furniture | 600 | Manufacturer Furniture/Total Furniture | Manufacturer Furniture/Total Furniture | 60% | 60% |
| Global | Sub-Category Chairs | 900 | - | Sub-Category Chairs/Total Furniture | - | 90% |
| Global | Manufacturer Chairs | 400 | Manufacturer Chairs/Sub-Category Chairs | Manufacturer Chairs/Sub-Category Chairs | 44% | 44% |
| Global | Sub-Category Tables | 700 | - | Sub-Category Tables/Total Furniture | - | 70% |
| Global | Manufacturer Tables | 500 | Manufacturer Tables/Sub-Category Tables | Manufacturer Tables/Sub-Category Tables | 71% | 71% |
| India | Total Furniture | 100 | - | Total Furniture/Total Furniture | - | 100% |
| India | Manufacturer Furniture | 80 | Manufacturer Furniture/Total Furniture | Manufacturer Furniture/Total Furniture | 80% | 80% |
| India | Sub-Category Chairs | 90 | - | Sub-Category Chairs/Total Furniture | - | 90% |
| India | Manufacturer Chairs | 70 | Manufacturer Chairs/Sub-Category Chairs | Manufacturer Chairs/Sub-Category Chairs | 78% | 78% |
| India | Sub-Category Tables | 50 | - | Sub-Category Tables/Total Furniture | - | 50% |
| India | Manufacturer Tables | 40 | Manufacturer Tables/Sub-Category Tables | Manufacturer Tables/Sub-Category Tables | 80% | 80% |
Helpful resources

Microsoft Fabric Learn Together
Covering the world! 9:00-10:30 AM Sydney, 4:00-5:30 PM CET (Paris/Berlin), 7:00-8:30 PM Mexico City

Power BI Monthly Update - April 2024
Check out the April 2024 Power BI update to learn about new features.

| User | Count |
|---|---|
| 109 | |
| 106 | |
| 87 | |
| 75 | |
| 66 |
| User | Count |
|---|---|
| 125 | |
| 114 | |
| 98 | |
| 81 | |
| 73 |


