FabCon is coming to Atlanta
Join us at FabCon Atlanta from March 16 - 20, 2026, for the ultimate Fabric, Power BI, AI and SQL community-led event. Save $200 with code FABCOMM.
Register now!- Power BI forums
- Get Help with Power BI
- Desktop
- Service
- Report Server
- Power Query
- Mobile Apps
- Developer
- DAX Commands and Tips
- Custom Visuals Development Discussion
- Health and Life Sciences
- Power BI Spanish forums
- Translated Spanish Desktop
- Training and Consulting
- Instructor Led Training
- Dashboard in a Day for Women, by Women
- Galleries
- Data Stories Gallery
- Themes Gallery
- Contests Gallery
- Quick Measures Gallery
- Notebook Gallery
- Translytical Task Flow Gallery
- TMDL Gallery
- R Script Showcase
- Webinars and Video Gallery
- Ideas
- Custom Visuals Ideas (read-only)
- Issues
- Issues
- Events
- Upcoming Events
To celebrate FabCon Vienna, we are offering 50% off select exams. Ends October 3rd. Request your discount now.
- Power BI forums
- Forums
- Get Help with Power BI
- Desktop
- DAX for showing SIX months data based on date sele...
- Subscribe to RSS Feed
- Mark Topic as New
- Mark Topic as Read
- Float this Topic for Current User
- Bookmark
- Subscribe
- Printer Friendly Page
- Mark as New
- Bookmark
- Subscribe
- Mute
- Subscribe to RSS Feed
- Permalink
- Report Inappropriate Content
DAX for showing SIX months data based on date selected in Visual
Hi - I have to show six months trend based on selected Month and metric in Matrix Visualization.
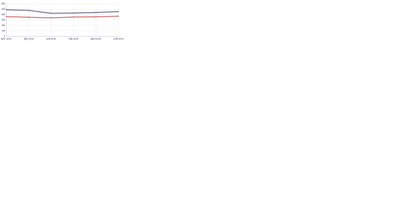
For Example if April 2019 and metric 4 is selected for given Student in the matrix visual , graph with previous 6 months trend ( Nov 2018 , Dec 2018 , Jan 2019 , feb 2019, march 2019,april 2019) for 2 measures (Say measaure 1 and Measure 2) should be shown. below is the data model. and expected Visualization. Is it possible ?
i tried with dax , but as soon as i selected . It filters out the data. Even if i ignore it in the DAX using ALL and other functions it doesnt work as expected Visual


Solved! Go to Solution.
- Mark as New
- Bookmark
- Subscribe
- Mute
- Subscribe to RSS Feed
- Permalink
- Report Inappropriate Content
You may have a look at this article.Attached the sample file for your reference.
Regards
If this post helps, then please consider Accept it as the solution to help the other members find it more quickly.


