- Power BI forums
- Updates
- News & Announcements
- Get Help with Power BI
- Desktop
- Service
- Report Server
- Power Query
- Mobile Apps
- Developer
- DAX Commands and Tips
- Custom Visuals Development Discussion
- Health and Life Sciences
- Power BI Spanish forums
- Translated Spanish Desktop
- Power Platform Integration - Better Together!
- Power Platform Integrations (Read-only)
- Power Platform and Dynamics 365 Integrations (Read-only)
- Training and Consulting
- Instructor Led Training
- Dashboard in a Day for Women, by Women
- Galleries
- Community Connections & How-To Videos
- COVID-19 Data Stories Gallery
- Themes Gallery
- Data Stories Gallery
- R Script Showcase
- Webinars and Video Gallery
- Quick Measures Gallery
- 2021 MSBizAppsSummit Gallery
- 2020 MSBizAppsSummit Gallery
- 2019 MSBizAppsSummit Gallery
- Events
- Ideas
- Custom Visuals Ideas
- Issues
- Issues
- Events
- Upcoming Events
- Community Blog
- Power BI Community Blog
- Custom Visuals Community Blog
- Community Support
- Community Accounts & Registration
- Using the Community
- Community Feedback
Earn a 50% discount on the DP-600 certification exam by completing the Fabric 30 Days to Learn It challenge.
- Power BI forums
- Forums
- Get Help with Power BI
- Desktop
- Re: DAX TOP N Measure on a Matrix Issue
- Subscribe to RSS Feed
- Mark Topic as New
- Mark Topic as Read
- Float this Topic for Current User
- Bookmark
- Subscribe
- Printer Friendly Page
- Mark as New
- Bookmark
- Subscribe
- Mute
- Subscribe to RSS Feed
- Permalink
- Report Inappropriate Content
DAX TOP N Measure on a Matrix Issue
Hello,
I have a requirement to display TOP 10 States on a Volume measure across a matrix visual. I have used the TOP N DAX Measure to achieve this :
CALCULATE([Volume], TOPN(10, ALL(dimGeography[State_Code]), [Volume], DESC), VALUES(dimGeography[State_Code]))Now if I use this measure on a matrix with just the State field on the Columns it works fine by displaying the TOP 10 states:
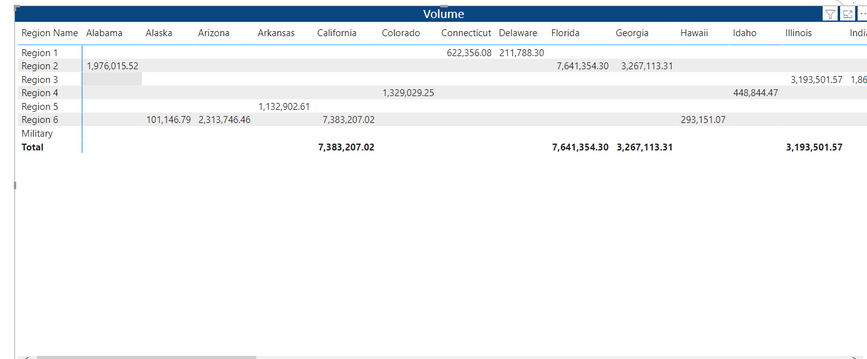
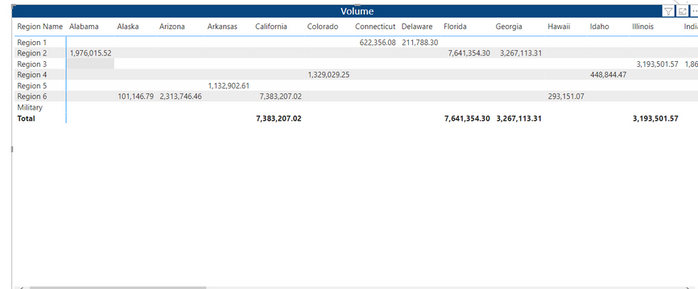
But if I were to include some field on the rows of the matrix as well, its doesn't display the true TOP 10 states but TOP 10 for each item on the row. The bigger problem is that the Total appears only for the True TOP 10 states and not others:
I think this is correct because when you include a field for the row, it considers the row context and pulls TOP 10 for that row. And the Totals are showing up only on the actual true TOP 10 states and not others. But is there a way to tweak the measure or visual to just display the True TOP 10 states only when including a row field as well? I am guessing that it would involve eliminating the row context on the measure.
I have also tried using a variation using RANKX to acheive this TOP 10 measure but its the same result.
CALCULATE([Volume], FILTER(VALUES(dimGeography[State_Code]),IF(RANKX(ALL(dimGeography[State_Code]),[Volume],,DESC)<=10,[Net Revenue], BLANK())))
Would appreciate any help on this. Please let me know if you need more information!
Solved! Go to Solution.
- Mark as New
- Bookmark
- Subscribe
- Mute
- Subscribe to RSS Feed
- Permalink
- Report Inappropriate Content
@Koushikrish glad it worked!
To also remove the filter from Brand, this below might work (I've not tested this)
    CALCULATE(
        [Volume],
        TOPN(10,
            ALL(dimGeography[State_Code], dimGeography[RegionName]),
            CALCULATE([Volume], ALL('dimBrand'[BrandName]))
            DESC
        ),
        VALUES(dimGeography[State_Code])
    )
- Mark as New
- Bookmark
- Subscribe
- Mute
- Subscribe to RSS Feed
- Permalink
- Report Inappropriate Content
@Koushikrish , how should the visual look when you have Region added? Could you post the desired output, please.
- Mark as New
- Bookmark
- Subscribe
- Mute
- Subscribe to RSS Feed
- Permalink
- Report Inappropriate Content
Hello @Anonymous. These are the top 10 states. My desired output is to retain these Top 10 states only across columns even if I include anything on the rows.
Top 10 states:
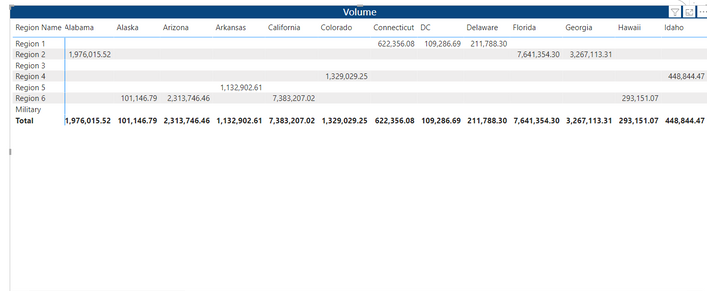
This is how I need it when I include Region Name on the columns :
But right now it shows this way when I include Region Name, its displaying the Top 10 states for each Region.
Hope that info was sufficient. Else please let me know.
- Mark as New
- Bookmark
- Subscribe
- Mute
- Subscribe to RSS Feed
- Permalink
- Report Inappropriate Content
@Koushikrish I tried with some sample data but couldn't reproduce the first image in your firdt post.
I think that perhaps that when the Region field is added, you need the measure remove the filters from the Region Field. I think this will do it:
    CALCULATE(
        [Volume],
        TOPN(10,
            ALL(dimGeography[State_Code], dimGeography[RegionName]),
            [Volume],
            DESC
        ),
        VALUES(dimGeography[State_Code])
    )
- Mark as New
- Bookmark
- Subscribe
- Mute
- Subscribe to RSS Feed
- Permalink
- Report Inappropriate Content
@Anonymous : This worked great, thank you! I have another question though. Consider I have to include another column from another table on the Row (instead of Region Name). Is there a way to get rid of the filter without explicity specifiying the field name?
For example, I tried to use another column called Brand Family on the row but it won't work as filter is removed only on the Region Name. I also tried this but didn't work as it looks like arguments for ALL function must be from same table.
- Mark as New
- Bookmark
- Subscribe
- Mute
- Subscribe to RSS Feed
- Permalink
- Report Inappropriate Content
@Koushikrish glad it worked!
To also remove the filter from Brand, this below might work (I've not tested this)
    CALCULATE(
        [Volume],
        TOPN(10,
            ALL(dimGeography[State_Code], dimGeography[RegionName]),
            CALCULATE([Volume], ALL('dimBrand'[BrandName]))
            DESC
        ),
        VALUES(dimGeography[State_Code])
    )
- Mark as New
- Bookmark
- Subscribe
- Mute
- Subscribe to RSS Feed
- Permalink
- Report Inappropriate Content
@Anonymous : that worked great as well. Got the result as I desired for exactly! Thanks a lot for your help on this!! 😊
- Mark as New
- Bookmark
- Subscribe
- Mute
- Subscribe to RSS Feed
- Permalink
- Report Inappropriate Content
@Koushikrish , try if this can help
measure =
var _tab = TOPN(10, ALL(dimGeography[State_Code]), [Volume], DESC)
return
CALCULATE([Volume], FILTER(VALUES(dimGeography[State_Code]),dimGeography[State_Code] in _tab))
Microsoft Power BI Learning Resources, 2023 !!
Learn Power BI - Full Course with Dec-2022, with Window, Index, Offset, 100+ Topics !!
Did I answer your question? Mark my post as a solution! Appreciate your Kudos !! Proud to be a Super User! !!
- Mark as New
- Bookmark
- Subscribe
- Mute
- Subscribe to RSS Feed
- Permalink
- Report Inappropriate Content
Hi @amitchandak , thanks for the response. This doesn't seem to fix the issue though. It doesn't appear to show just top 10 but all states and mapped to their corresponding region :
Helpful resources
| User | Count |
|---|---|
| 102 | |
| 90 | |
| 80 | |
| 71 | |
| 70 |
| User | Count |
|---|---|
| 114 | |
| 100 | |
| 97 | |
| 72 | |
| 71 |


