New Offer! Become a Certified Fabric Data Engineer
Check your eligibility for this 50% exam voucher offer and join us for free live learning sessions to get prepared for Exam DP-700.
Get Started- Power BI forums
- Get Help with Power BI
- Desktop
- Service
- Report Server
- Power Query
- Mobile Apps
- Developer
- DAX Commands and Tips
- Custom Visuals Development Discussion
- Health and Life Sciences
- Power BI Spanish forums
- Translated Spanish Desktop
- Training and Consulting
- Instructor Led Training
- Dashboard in a Day for Women, by Women
- Galleries
- Community Connections & How-To Videos
- COVID-19 Data Stories Gallery
- Themes Gallery
- Data Stories Gallery
- R Script Showcase
- Webinars and Video Gallery
- Quick Measures Gallery
- 2021 MSBizAppsSummit Gallery
- 2020 MSBizAppsSummit Gallery
- 2019 MSBizAppsSummit Gallery
- Events
- Ideas
- Custom Visuals Ideas
- Issues
- Issues
- Events
- Upcoming Events
Don't miss out! 2025 Microsoft Fabric Community Conference, March 31 - April 2, Las Vegas, Nevada. Use code MSCUST for a $150 discount. Prices go up February 11th. Register now.
- Power BI forums
- Forums
- Get Help with Power BI
- Desktop
- Re: DAX REMOVEFILTERS() Issues
- Subscribe to RSS Feed
- Mark Topic as New
- Mark Topic as Read
- Float this Topic for Current User
- Bookmark
- Subscribe
- Printer Friendly Page
- Mark as New
- Bookmark
- Subscribe
- Mute
- Subscribe to RSS Feed
- Permalink
- Report Inappropriate Content
DAX REMOVEFILTERS() Issues
Hello,
I am attempting to use the REMOVEFILTERS() function to ignore a slicer slection in a measure. My goal is to show one day with Projections for 2023, have a second table that will show data from 2022 (depending on a slicer selection for "Version" either "AOP' or "Prior Year"), and a third table to show the variance between the two. This variance calculation needs to ignore the slicer selection so that it can pick of the Projections for 2023 values, but then determine which values from 2022 ("AOP" or "Prior Year") to pick up based on the slicer selection for "Version" and calculate the difference of the two values. See the screenshot below for my current state and a screenshot of my test data.
Purple box: Projected 2023 data
Orange box: 2022 data, determined by "Version" slicer at the top = "Prior Year" for this example
Yellow box: Using the current DAX formula that is incorrect (DAX shown below). If you look at the data, it is summing the 2022 "AOP" and "Prior Year" data for the Periods ending in 2022, but it is still filtering out the 2023 Projection data. Ideally, this should show 6 periods to include all data, completely ignoring the Version slicer without editing the interactions between the two visuals.
Value Unfiltered =
CALCULATE(SUM('Test Variance'[Value]), REMOVEFILTERS('Test Variance'[Version]))
I believe this has something to do with auto-exist, but I cannot make sense of this linked article. Any help solving this is greatly appreciated! Thanks!!
- Mark as New
- Bookmark
- Subscribe
- Mute
- Subscribe to RSS Feed
- Permalink
- Report Inappropriate Content
Hi, @Anonymous
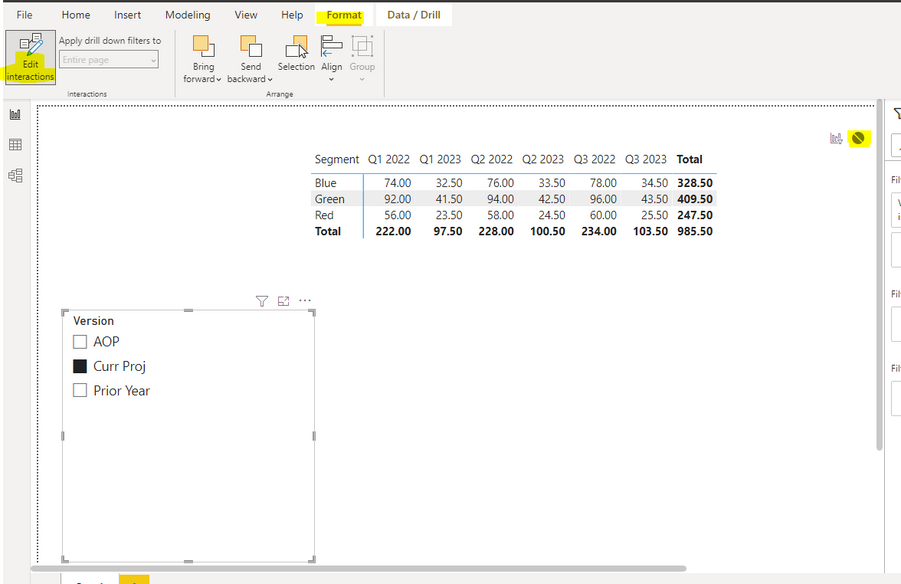
According to your description , for the third visual you want to ignore the filtering of the slicers. Right?
All you have to do is select the slicer, click "Edit interactions" in the "Format", and close the slicer you don't want to filter,like this:
Best Regards,
Aniya Zhang
If this post helps, then please consider Accept it as the solution to help the other members find it more quickly
- Mark as New
- Bookmark
- Subscribe
- Mute
- Subscribe to RSS Feed
- Permalink
- Report Inappropriate Content
I have a greater issue past what this original post is about and editing the interactions is not an option. I still need the visual to interact with the slicer for one aspect of a measure I am attempting to create but ignore the slicer for another aspect.
- Mark as New
- Bookmark
- Subscribe
- Mute
- Subscribe to RSS Feed
- Permalink
- Report Inappropriate Content
If it is caused by auto-exist the simplest way to fix it is to move either the attribute or the version column into a separate dimension table and then use the column from the new table in all visuals and slicers.
The simplest way to create a dimension table is
Dim table = ALLNOBLANKROW('Fact table'[Column])then create a one-to-many single direction relationship from the dimension to the fact table.
Helpful resources

Join us at the Microsoft Fabric Community Conference
March 31 - April 2, 2025, in Las Vegas, Nevada. Use code MSCUST for a $150 discount! Prices go up Feb. 11th.

Power BI Monthly Update - January 2025
Check out the January 2025 Power BI update to learn about new features in Reporting, Modeling, and Data Connectivity.

| User | Count |
|---|---|
| 143 | |
| 85 | |
| 66 | |
| 51 | |
| 45 |
| User | Count |
|---|---|
| 216 | |
| 89 | |
| 82 | |
| 66 | |
| 57 |


