Get certified for free when you join Fabric Data Days 2026 and dive into Fabric, Power BI, SQL, AI, and other essential data skills.
Join nowJuly 7 - July 17 | Round 2 of the Power BI Dataviz World Championships. Don't miss your chance! Learn more
Hi there! My first post here and I guess it's a more complicated problem. The following data is given (excluding the win column!):
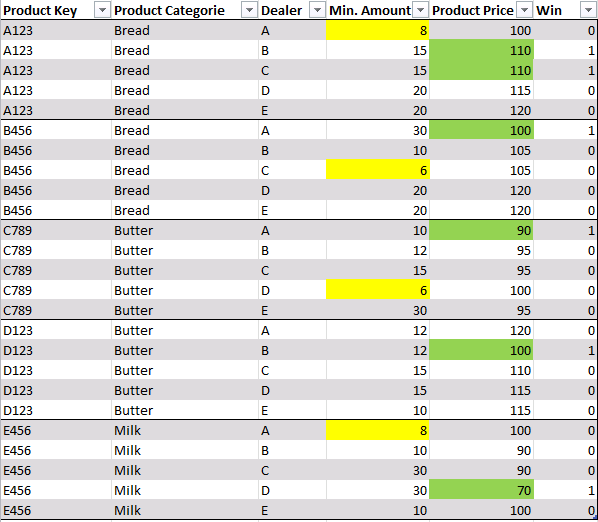
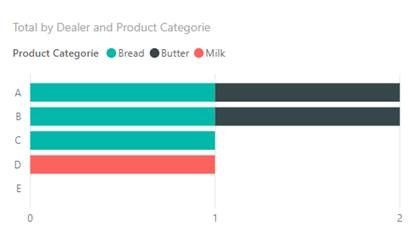
I have serveral dealers that sell the same products (look for product key) at different product prices and I would like to know the best dealer for each Product and in the second step for each product Categorie under the condition that he sells a minimum amount of 10 prodcts in each trade. If there are two dealers who have an equally good/best price they both "win" for that product. In the end I would like to have a stacked bar chart, that looks something like this:
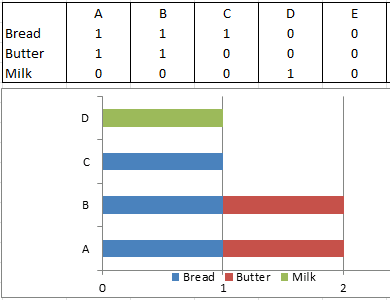
It shows how often the dealers have the best price in each product categorie. I figure I need to perform the following steps:
- filter out the rows that have a min. amount that is <10
- group the products by product key and find the best price for each product key group (groupby + minx function??)
- ad a win to each dealer who has the lowest price for a certain product key
- if there are two or more equally low prices several dealers "win"
- in the end i need to sum up the wins of each dealer grouped by product categorie
I couldn't figure out the right DAX code until now, since I am quite new to DAX. Hope you guys can give me some valuable tips.
Thank you!
Thilo
Solved! Go to Solution.
Hi @Thilo ,
The following is my sample you can have a try.
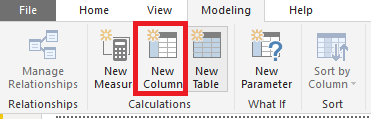
Min = CALCULATE(MIN(Table1[Product Price]),FILTER(Table1,Table1[Product Key] = EARLIER(Table1[Product Key]) && Table1[Product Categorie] = EARLIER(Table1[Product Categorie]) && Table1[Min.Amount] >=10))
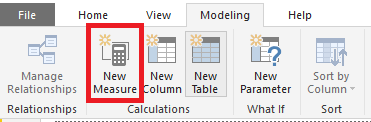
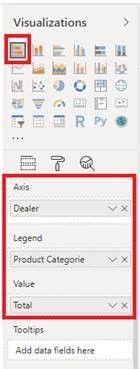
Win = VAR a = CALCULATE(MIN(Table1[Min]),FILTER(Table1,Table1[Min.Amount] >=10)) return IF(MAX(Table1[Product Price]) = a, 1,0) Total = SUMX(Table1,[Win])
Best Regards,
Xue Ding
If this post helps, then please consider Accept it as the solution to help the other members find it more quickly.
Hi @Thilo ,
The following is my sample you can have a try.
Min = CALCULATE(MIN(Table1[Product Price]),FILTER(Table1,Table1[Product Key] = EARLIER(Table1[Product Key]) && Table1[Product Categorie] = EARLIER(Table1[Product Categorie]) && Table1[Min.Amount] >=10))
Win = VAR a = CALCULATE(MIN(Table1[Min]),FILTER(Table1,Table1[Min.Amount] >=10)) return IF(MAX(Table1[Product Price]) = a, 1,0) Total = SUMX(Table1,[Win])
Best Regards,
Xue Ding
If this post helps, then please consider Accept it as the solution to help the other members find it more quickly.
@v-xuding-msft
Thank you very much Xue! Your solution is working for the test date. Concerning the real data I still have some issues, but I am positive that I'll be able to resolve them.
Best wishes
Thilo
Join us in Barcelona for FabCon and SQLCon, the Fabric, Power BI, SQL, and AI community event. Save €200 with code FABCMTY200.
Join Data Days 2026: 60 days of free live/on-demand sessions, challenges, study groups, and certification opportunities.
| User | Count |
|---|---|
| 29 | |
| 23 | |
| 18 | |
| 18 | |
| 15 |
| User | Count |
|---|---|
| 51 | |
| 44 | |
| 43 | |
| 39 | |
| 32 |