FabCon is coming to Atlanta
Join us at FabCon Atlanta from March 16 - 20, 2026, for the ultimate Fabric, Power BI, AI and SQL community-led event. Save $200 with code FABCOMM.
Register now!- Power BI forums
- Get Help with Power BI
- Desktop
- Service
- Report Server
- Power Query
- Mobile Apps
- Developer
- DAX Commands and Tips
- Custom Visuals Development Discussion
- Health and Life Sciences
- Power BI Spanish forums
- Translated Spanish Desktop
- Training and Consulting
- Instructor Led Training
- Dashboard in a Day for Women, by Women
- Galleries
- Data Stories Gallery
- Themes Gallery
- Contests Gallery
- QuickViz Gallery
- Quick Measures Gallery
- Visual Calculations Gallery
- Notebook Gallery
- Translytical Task Flow Gallery
- TMDL Gallery
- R Script Showcase
- Webinars and Video Gallery
- Ideas
- Custom Visuals Ideas (read-only)
- Issues
- Issues
- Events
- Upcoming Events
Get Fabric Certified for FREE during Fabric Data Days. Don't miss your chance! Request now
- Power BI forums
- Forums
- Get Help with Power BI
- Desktop
- Re: Creating and Switching between Currencies
- Subscribe to RSS Feed
- Mark Topic as New
- Mark Topic as Read
- Float this Topic for Current User
- Bookmark
- Subscribe
- Printer Friendly Page
- Mark as New
- Bookmark
- Subscribe
- Mute
- Subscribe to RSS Feed
- Permalink
- Report Inappropriate Content
Creating and Switching between Currencies
Hi,
I would like to get a suggestion for my issue. Currently, I am receiving many documents in different reporting currencies. So my calculations are as follows:
- I am receiving documents with different reporting currencies and with their unique Identifiers (GBP, EUR, USD).
- I have a different Currency_Exchange table.
- I am merging both tables based on the Unique Identifier (GBP = GBP, USD=USD, GBP=GBP).
- After merging, I am expanding the Units_Per_EUR and everything is being calculated based on the conversion in EUR (if 200 USD it will output as 189,97 EUR).
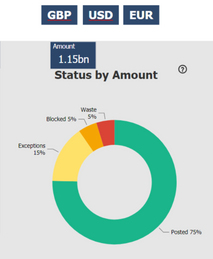
Now I am trying to show the total amount as default in EUR, but also in USD or GBP if the right tile is being pressed or selected as:
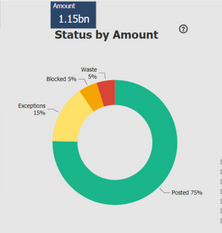
Also, will the Pie Chart will be updated accordingly? And how could I achieve such functionality? Any tips or suggestions would be highly appreciated.
Cheers,
Matas
Solved! Go to Solution.
- Mark as New
- Bookmark
- Subscribe
- Mute
- Subscribe to RSS Feed
- Permalink
- Report Inappropriate Content
@Matas , A very similar topics ha been solved here, see if that can help
https://www.sqlbi.com/articles/currency-conversion-in-power-bi-reports/
- Mark as New
- Bookmark
- Subscribe
- Mute
- Subscribe to RSS Feed
- Permalink
- Report Inappropriate Content
Thank you for all the suggestions.
I was able to figure it out pretty much by combining all of your provided information.
Cheers!
- Mark as New
- Bookmark
- Subscribe
- Mute
- Subscribe to RSS Feed
- Permalink
- Report Inappropriate Content
Change your GBP, EUR and DOL queries to a merge with the exchange rate file.
The amounts as a new base currency column eg all GBP.
Then create a Currency pick list table
| Currency | Exchangerate |
| GBP | 1 |
| EUR | 1.19 |
| DOL | 1.26 |
and this measure
GBPAmount =
SUM(Sales[GMPValue)])
Sales in currency =
VAY myexchangerate= SELECT(picklist(Exchangerate))
RETURN
[GBPAmount] * myexchangerate
The either add a slicer with the picklist(Currency)
or use the filter menu to specify the picklist(Currency) for each visual.
Drag the [Sales in currency] to your visual and it should work.
Please click thumbs up and Accepot As Solution, thank you !
- Mark as New
- Bookmark
- Subscribe
- Mute
- Subscribe to RSS Feed
- Permalink
- Report Inappropriate Content
Hello @Matas ,
you could use the switch function as explained here
(775) DAX Fridays! #15: SWITCH - YouTube
You will need to use explicit measures and an additional table.
Is that what you are looking for?
best
hashtag_pete
- Mark as New
- Bookmark
- Subscribe
- Mute
- Subscribe to RSS Feed
- Permalink
- Report Inappropriate Content
@Matas , A very similar topics ha been solved here, see if that can help
https://www.sqlbi.com/articles/currency-conversion-in-power-bi-reports/
Helpful resources

Power BI Monthly Update - November 2025
Check out the November 2025 Power BI update to learn about new features.

Fabric Data Days
Advance your Data & AI career with 50 days of live learning, contests, hands-on challenges, study groups & certifications and more!

| User | Count |
|---|---|
| 102 | |
| 79 | |
| 57 | |
| 51 | |
| 46 |


