FabCon is coming to Atlanta
Join us at FabCon Atlanta from March 16 - 20, 2026, for the ultimate Fabric, Power BI, AI and SQL community-led event. Save $200 with code FABCOMM.
Register now!- Power BI forums
- Get Help with Power BI
- Desktop
- Service
- Report Server
- Power Query
- Mobile Apps
- Developer
- DAX Commands and Tips
- Custom Visuals Development Discussion
- Health and Life Sciences
- Power BI Spanish forums
- Translated Spanish Desktop
- Training and Consulting
- Instructor Led Training
- Dashboard in a Day for Women, by Women
- Galleries
- Data Stories Gallery
- Themes Gallery
- Contests Gallery
- QuickViz Gallery
- Quick Measures Gallery
- Visual Calculations Gallery
- Notebook Gallery
- Translytical Task Flow Gallery
- TMDL Gallery
- R Script Showcase
- Webinars and Video Gallery
- Ideas
- Custom Visuals Ideas (read-only)
- Issues
- Issues
- Events
- Upcoming Events
View all the Fabric Data Days sessions on demand. View schedule
- Power BI forums
- Forums
- Get Help with Power BI
- Desktop
- Creating Matrices in Report Builder that are Simil...
- Subscribe to RSS Feed
- Mark Topic as New
- Mark Topic as Read
- Float this Topic for Current User
- Bookmark
- Subscribe
- Printer Friendly Page
- Mark as New
- Bookmark
- Subscribe
- Mute
- Subscribe to RSS Feed
- Permalink
- Report Inappropriate Content
Creating Matrices in Report Builder that are Similar to Power BI
Good day,
I am trying to create a paginated report that has a matrix with a dynamic number of rows. I have tried both Microsoft Power BI Desktop and Microsoft Power BI Report Builder, and I would like to ask if there is a way that I can replicate the design that I made in Power BI Desktop in Report Builder. Both files used Matrices as the visuals.
Power BI Desktop
As shown above, the matrix is visualized similarly to a table, wherein the values are grouped by dates and shown as one row. As I need to export the values to a PDF file, having incomplete results due to the presence of a scroll bar when printing and not having the ability to print all the rows is unacceptable.
Power BI Report Builder
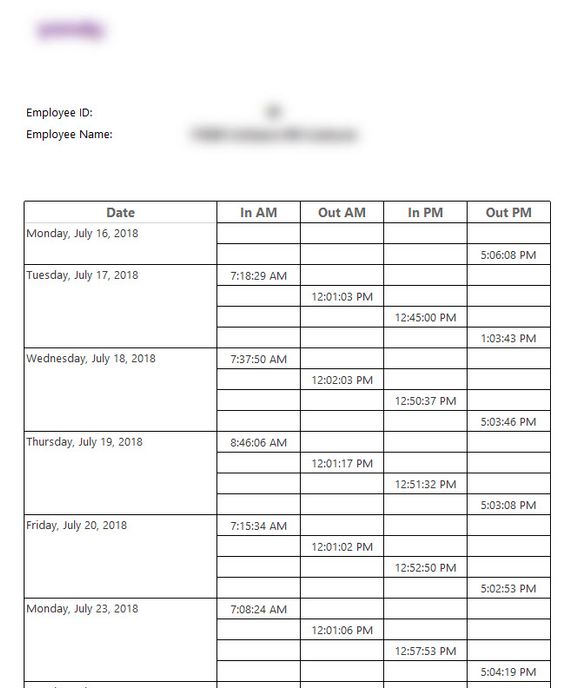
When the report was recreated in Power BI Report Builder, the values do not line up in one row similar to that in Power BI Desktop.
Is there a step that I missed or a process that I should do in order to properly recreate the matrix in Report Builder such that the values line up in one row according to date?
Thank you very much.
Nico
Solved! Go to Solution.
- Mark as New
- Bookmark
- Subscribe
- Mute
- Subscribe to RSS Feed
- Permalink
- Report Inappropriate Content
Hi @nidquival
You don't need to add four columns [IN AM], [OUT AM], [IN PM], [OUT PM] into the table for the matrix visual. There is an easier way if you add a conditional column into the table to tell the meaning of TNAEvent number 0,1,2,3. (E.g. Type column in the following images.)
In Power BI Desktop,
Put Date in Rows, Type in Columns and Time in Values.
The same in Report Builder:
Regards,
Community Support Team _ Jing
If this post helps, please Accept it as the solution to help other members find it.
- Mark as New
- Bookmark
- Subscribe
- Mute
- Subscribe to RSS Feed
- Permalink
- Report Inappropriate Content
- Mark as New
- Bookmark
- Subscribe
- Mute
- Subscribe to RSS Feed
- Permalink
- Report Inappropriate Content
@nidquival , I doubt in report builder date is not getting aggregated. Just check the aggregation for the date in the report builder. In Power matrix values are always aggregated
- Mark as New
- Bookmark
- Subscribe
- Mute
- Subscribe to RSS Feed
- Permalink
- Report Inappropriate Content
@amitchandak I checked the groupings. The matrix is grouped by Date. The values, however, do not seem to be placed in just one row.
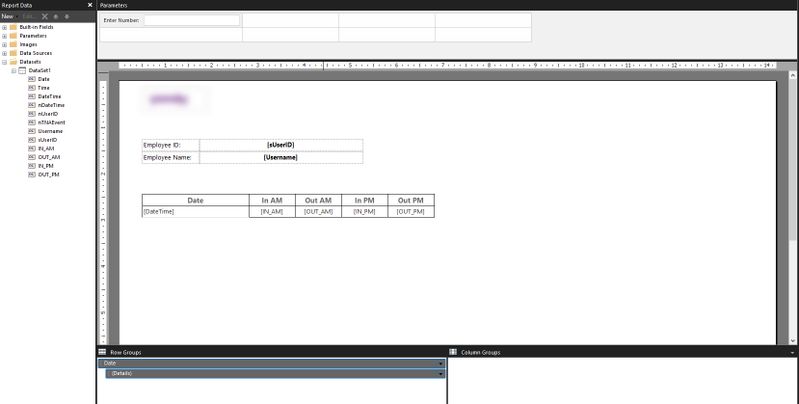
Here is the matrix that needs to be fixed. The Date is the parent group, while the IN_AM, OUT_AM, IN_PM, and OUT_PM are the values.
Do note that the values IN_AM, OUT_AM, IN_PM, OUT_PM are derivations from another value, DateTime.
Also, upon checking the matrix grouping properties, the parent group has a grouping based on the Date value.
Aggregating the values resulted in an error since, according to Report Builder, the values have filters.
Helpful resources

Power BI Monthly Update - November 2025
Check out the November 2025 Power BI update to learn about new features.

Fabric Data Days
Advance your Data & AI career with 50 days of live learning, contests, hands-on challenges, study groups & certifications and more!


