FabCon is coming to Atlanta
Join us at FabCon Atlanta from March 16 - 20, 2026, for the ultimate Fabric, Power BI, AI and SQL community-led event. Save $200 with code FABCOMM.
Register now!- Power BI forums
- Get Help with Power BI
- Desktop
- Service
- Report Server
- Power Query
- Mobile Apps
- Developer
- DAX Commands and Tips
- Custom Visuals Development Discussion
- Health and Life Sciences
- Power BI Spanish forums
- Translated Spanish Desktop
- Training and Consulting
- Instructor Led Training
- Dashboard in a Day for Women, by Women
- Galleries
- Data Stories Gallery
- Themes Gallery
- Contests Gallery
- QuickViz Gallery
- Quick Measures Gallery
- Visual Calculations Gallery
- Notebook Gallery
- Translytical Task Flow Gallery
- TMDL Gallery
- R Script Showcase
- Webinars and Video Gallery
- Ideas
- Custom Visuals Ideas (read-only)
- Issues
- Issues
- Events
- Upcoming Events
The Power BI Data Visualization World Championships is back! Get ahead of the game and start preparing now! Learn more
- Power BI forums
- Forums
- Get Help with Power BI
- Desktop
- Re: Create a gauge
- Subscribe to RSS Feed
- Mark Topic as New
- Mark Topic as Read
- Float this Topic for Current User
- Bookmark
- Subscribe
- Printer Friendly Page
- Mark as New
- Bookmark
- Subscribe
- Mute
- Subscribe to RSS Feed
- Permalink
- Report Inappropriate Content
Create a gauge
I'm trying to build a Gauge,
I managed to divide the data per the requested
The gauge shows rank divided as followed:
0-6 - Red
7-8 - Amber
9-10 - Green
I managed to create the following graph
and I used the following code
Solved! Go to Solution.
- Mark as New
- Bookmark
- Subscribe
- Mute
- Subscribe to RSS Feed
- Permalink
- Report Inappropriate Content
Hi @Rotemshan ,
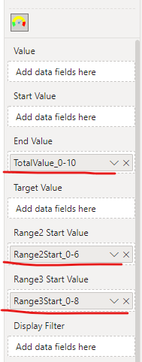
Please try the Tachometer visual and create the measures:
Range2Start_0-6 = MAX ( 'Response_table APAC'[0-6] )Range3Start_0-8 = [Range2Start_0-6] + MAX ( 'Response_table APAC'[7-8] )TotalValue_0-10 = MAX ( 'Response_table APAC'[0-10] )
If the problem is still not resolved, please provide detailed error information or the expected result you expect. Let me know immediately, looking forward to your reply.
Best Regards,
Winniz
If this post helps, then please consider Accept it as the solution to help the other members find it more quickly.
- Mark as New
- Bookmark
- Subscribe
- Mute
- Subscribe to RSS Feed
- Permalink
- Report Inappropriate Content
Hi @Rotemshan ,
Please try the following measures:
Range2Start_0-6 = SUM ( 'Response_table APAC'[0-6] )Range3Start_0-8 = [Range2Start_0-6] + SUM ( 'Response_table APAC'[7-8] )TotalValue_0-10 = [Range3Start_0-8] + SUM ( 'Response_table APAC'[9-10] )
If the problem is still not resolved, please provide detailed error information or the expected result you expect. Let me know immediately, looking forward to your reply.
Best Regards,
Winniz
- Mark as New
- Bookmark
- Subscribe
- Mute
- Subscribe to RSS Feed
- Permalink
- Report Inappropriate Content
Hi,
Another option is to create a Gauge that dynamically changes colour based on the current value.
For video demonstration, click the link: https://youtu.be/oEL36Fp3TU0
- Mark as New
- Bookmark
- Subscribe
- Mute
- Subscribe to RSS Feed
- Permalink
- Report Inappropriate Content
Hi @Rotemshan ,
Please try the Tachometer visual and create the measures:
Range2Start_0-6 = MAX ( 'Response_table APAC'[0-6] )Range3Start_0-8 = [Range2Start_0-6] + MAX ( 'Response_table APAC'[7-8] )TotalValue_0-10 = MAX ( 'Response_table APAC'[0-10] )
If the problem is still not resolved, please provide detailed error information or the expected result you expect. Let me know immediately, looking forward to your reply.
Best Regards,
Winniz
If this post helps, then please consider Accept it as the solution to help the other members find it more quickly.
- Mark as New
- Bookmark
- Subscribe
- Mute
- Subscribe to RSS Feed
- Permalink
- Report Inappropriate Content
Thank you for the detailed answer,
I would like to ask a few questions:
Why did you subtract the range of 0-8 instead of counting only 7-8? and the same for 0-10 instead of 9-10?
There is a calculation that should be done on the Is it possible to put the needle on 15?
Range2Start_0-6 = MAX ( 'Response_table APAC'[0-6] )
Range3Start_0-8 = [Range2Start_0-6] + MAX ( 'Response_table APAC'[7-8] )
TotalValue_0-10 = MAX ( 'Response_table APAC'[0-10] )
- Mark as New
- Bookmark
- Subscribe
- Mute
- Subscribe to RSS Feed
- Permalink
- Report Inappropriate Content
Hi @Rotemshan ,
The Tachometer visual does not automatically accumulate the values of each range, so we need to specify the starting value of each range. The descripyion of these labels are as follows.
|
FIELD |
DESCRIPTION | CONSTRAINTS |
|---|---|---|
| End Value | The End Value for the Tachometer Arc | If “Start Value” is the minimum value in the value range, then “End Value” should be the maximum value in the value range or vice versa. All values defined by other Data Roles should lie between Start Value and End Value. |
| Target Value | The Target value that will be displayed by the target line. | Value should be between “Start Value” and “End Value” to be to be displayed on the gauge. Note.Tachometer visual will attempt to position the label indicating target value such that it does not overlap any Axis Labels or Callout values. However, target value label may not be rendered in case Tachometer is unable to relocate target label in the visinity of target line. |
| Range 2 Start Value | This is the starting value for “Range 2”. This is also the End value for Range 1. | Value should be between “Start Value” and “End Value” to be to be displayed on the gauge.In addition, this value should be between “Start Value” and “Range 3 Start Value” when “Range 3 Start Value” is available. |
| Range 3 Start Value | This is the starting value for “Range 3”. This is also the End value for Range 2 when “Range 2 Start Value” is defined. When “Range 2 Start Value” is not provided, this will also be the End Value for Range 1. | Value should be between “Start Value” and “End Value” to be to be displayed on the gauge. In addition, this value should be between “Range 2 Start Value” and “End Value” when “Range 2 Start Value” is available. |
For more information, please refer to: Visual Awesomeness Unlocked: Tachometer Gauge Custom Visual
Best Regards,
Winniz
- Mark as New
- Bookmark
- Subscribe
- Mute
- Subscribe to RSS Feed
- Permalink
- Report Inappropriate Content
- Mark as New
- Bookmark
- Subscribe
- Mute
- Subscribe to RSS Feed
- Permalink
- Report Inappropriate Content
Hi @Rotemshan ,
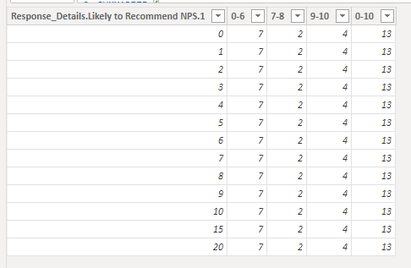
In my data, [0-6], [7-8], [9-10], [0-10] are the columns in the table (and each row is duplicate value), so I calculated the maximum value of these columns.
How are your Detractor, Passive and Promoter calculated? Are they from three separate columns or one measure?
Best Regards,
Winniz
- Mark as New
- Bookmark
- Subscribe
- Mute
- Subscribe to RSS Feed
- Permalink
- Report Inappropriate Content
Hello @v-kkf-msft
as I presented in the first post,
I created a new table and I'm using the following formula (I'm not sure this is the recommended way to do it )
then I'm getting the following as fields available for me
which creates the following table
- Mark as New
- Bookmark
- Subscribe
- Mute
- Subscribe to RSS Feed
- Permalink
- Report Inappropriate Content
Hi @Rotemshan ,
Please try the following measures:
Range2Start_0-6 = SUM ( 'Response_table APAC'[0-6] )Range3Start_0-8 = [Range2Start_0-6] + SUM ( 'Response_table APAC'[7-8] )TotalValue_0-10 = [Range3Start_0-8] + SUM ( 'Response_table APAC'[9-10] )
If the problem is still not resolved, please provide detailed error information or the expected result you expect. Let me know immediately, looking forward to your reply.
Best Regards,
Winniz
- Mark as New
- Bookmark
- Subscribe
- Mute
- Subscribe to RSS Feed
- Permalink
- Report Inappropriate Content
change the chart type to stacked bar chart.
Helpful resources

Power BI Dataviz World Championships
The Power BI Data Visualization World Championships is back! Get ahead of the game and start preparing now!

| User | Count |
|---|---|
| 39 | |
| 37 | |
| 33 | |
| 33 | |
| 29 |
| User | Count |
|---|---|
| 134 | |
| 96 | |
| 78 | |
| 67 | |
| 65 |


