Party with Power BI’s own Guy in a Cube
Power BI is turning 10! Tune in for a special live episode on July 24 with behind-the-scenes stories, product evolution highlights, and a sneak peek at what’s in store for the future.
Save the date- Power BI forums
- Get Help with Power BI
- Desktop
- Service
- Report Server
- Power Query
- Mobile Apps
- Developer
- DAX Commands and Tips
- Custom Visuals Development Discussion
- Health and Life Sciences
- Power BI Spanish forums
- Translated Spanish Desktop
- Training and Consulting
- Instructor Led Training
- Dashboard in a Day for Women, by Women
- Galleries
- Data Stories Gallery
- Themes Gallery
- Contests Gallery
- Quick Measures Gallery
- Notebook Gallery
- Translytical Task Flow Gallery
- TMDL Gallery
- R Script Showcase
- Webinars and Video Gallery
- Ideas
- Custom Visuals Ideas (read-only)
- Issues
- Issues
- Events
- Upcoming Events
Enhance your career with this limited time 50% discount on Fabric and Power BI exams. Ends August 31st. Request your voucher.
- Power BI forums
- Forums
- Get Help with Power BI
- Desktop
- Counting Base on Week on Week result - Day in Raw ...
- Subscribe to RSS Feed
- Mark Topic as New
- Mark Topic as Read
- Float this Topic for Current User
- Bookmark
- Subscribe
- Printer Friendly Page
- Mark as New
- Bookmark
- Subscribe
- Mute
- Subscribe to RSS Feed
- Permalink
- Report Inappropriate Content
Counting Base on Week on Week result - Day in Raw Data
Hi Senior Users,
Can you please help to advise on this. Sample PBI file is here for download.
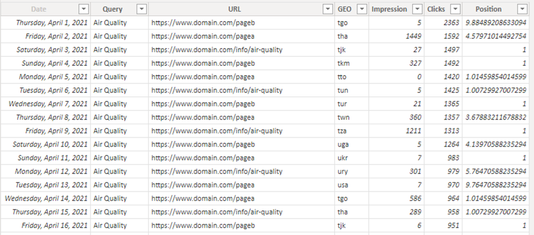
In the raw data, there is Clicks by Query, URL by Day
I have created metric for Week on Week changed Clicks:
Clicks WoW Change =
var lastweeknum =
CALCULATE(
    MAX('Date'[YearWeek]),
    FILTER(
        ALL('Date'),
        [YearWeek]<MAX('Date'[YearWeek])
    )
)
var lastweekamount =
CALCULATE(
    SUM(Metrics[Clicks]),
    FILTER(
          ALL('Date'),
          [YearWeek]=lastweeknum
    )
)
return CALCULATE(SUM(Metrics[Clicks])-lastweekamount)
Then, how to get: how many URLs got more or less Clicks in this week compare to last week clicks?
For example,
For week 04-APR, 2 URLs got less Clicks, 9 URLs got more.
For week 11-APR, 3 URLs got less Clicks, 8 URLs got more.
Thank you.
H
Solved! Go to Solution.
- Mark as New
- Bookmark
- Subscribe
- Mute
- Subscribe to RSS Feed
- Permalink
- Report Inappropriate Content
Hi,
I am not sure how you want to show the visualization, but I assume you want to display the result on the total row of the matrix visualization.
Please check the below picture and the attached pbix file.
WoW more or less count: =
IF (
HASONEVALUE ( Metrics[URL] )
|| [Clicks WoW Change] = BLANK (),
[Clicks WoW Change],
VAR newtable =
ADDCOLUMNS (
SUMMARIZE ( ALL ( Metrics ), Metrics[URL], 'Date'[YearWeek] ),
"@countdiff", [Clicks WoW Change]
)
RETURN
"Thisweekmore: "
& COUNTROWS ( FILTER ( newtable, [@countdiff] > 0 ) ) & " / Thisweekless: "
& COUNTROWS ( FILTER ( newtable, [@countdiff] < 0 ) )
)
If this post helps, then please consider accepting it as the solution to help other members find it faster, and give a big thumbs up.
Click here to visit my LinkedIn page
Click here to schedule a short Teams meeting to discuss your question.
- Mark as New
- Bookmark
- Subscribe
- Mute
- Subscribe to RSS Feed
- Permalink
- Report Inappropriate Content
Thanks for the help @Jihwan_Kim , I was thinking just to make another table to list:
Then when apply URL, it can breakdown to see which of the URLs got more/less.
But you've provided very helpful info.
Thanks again.
Have a nice day!
- Mark as New
- Bookmark
- Subscribe
- Mute
- Subscribe to RSS Feed
- Permalink
- Report Inappropriate Content
@h_l , Use week rank on year week or week start date
example
new columns
Week Rank = RANKX(all('Date'),'Date'[Week Start date],,ASC,Dense)
OR
Week Rank = RANKX(all('Date'),'Date'[Year Week],,ASC,Dense) //YYYYWW format
measure example
This Week = CALCULATE(sum('Table'[Qty]), FILTER(ALL('Date'),'Date'[Week Rank]=max('Date'[Week Rank])))
Last Week = CALCULATE(sum('Table'[Qty]), FILTER(ALL('Date'),'Date'[Week Rank]=max('Date'[Week Rank])-1))
- Mark as New
- Bookmark
- Subscribe
- Mute
- Subscribe to RSS Feed
- Permalink
- Report Inappropriate Content
Helpful resources
| User | Count |
|---|---|
| 77 | |
| 74 | |
| 42 | |
| 32 | |
| 28 |
| User | Count |
|---|---|
| 100 | |
| 93 | |
| 52 | |
| 50 | |
| 48 |


