Forum Discussion

apatnola's avatar
apatnola
Icon for Helper I rankHelper I
7 years ago
Solved

Count rows by Year

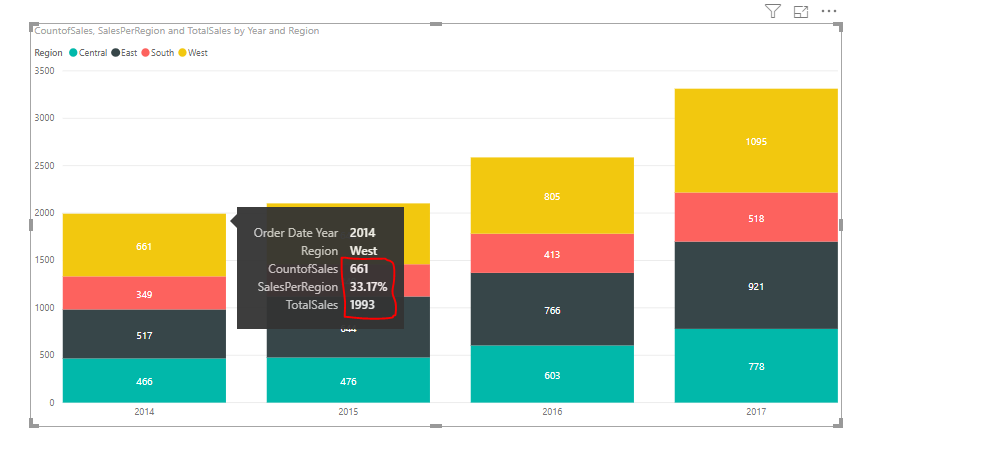
I want to figure out how to show each person's % of the total year in the stacked column chart below. Each color below represents the count for each employee. I want to show as a tool tip each color'...
  • JIGAR's avatar
    7 years ago

    apatnola 


    You can create 3 measures


    1. TotalCount = CALCULATE(COUNT(Table[Column]))


    Use this 1st measure as value


    2. TotalCountForAllEmployees = CALCULATE(COUNT(Table[Column]),ALL(Table[Employees]))


    3. %CountPerEmployee = DIVIDE(TotalCount,TotalCountForAllEmployees)


    Use this 3rd measure as tooltip.


    I assume you are using Employees as Legend values.


    Attached is a example of how this is going to look. I am using Region instead of Employees. 


    Hope this helps !!


    Thanks