FabCon is coming to Atlanta
Join us at FabCon Atlanta from March 16 - 20, 2026, for the ultimate Fabric, Power BI, AI and SQL community-led event. Save $200 with code FABCOMM.
Register now!- Power BI forums
- Get Help with Power BI
- Desktop
- Service
- Report Server
- Power Query
- Mobile Apps
- Developer
- DAX Commands and Tips
- Custom Visuals Development Discussion
- Health and Life Sciences
- Power BI Spanish forums
- Translated Spanish Desktop
- Training and Consulting
- Instructor Led Training
- Dashboard in a Day for Women, by Women
- Galleries
- Data Stories Gallery
- Themes Gallery
- Contests Gallery
- Quick Measures Gallery
- Notebook Gallery
- Translytical Task Flow Gallery
- TMDL Gallery
- R Script Showcase
- Webinars and Video Gallery
- Ideas
- Custom Visuals Ideas (read-only)
- Issues
- Issues
- Events
- Upcoming Events
To celebrate FabCon Vienna, we are offering 50% off select exams. Ends October 3rd. Request your discount now.
- Power BI forums
- Forums
- Get Help with Power BI
- Desktop
- Count instances only if categorised the same for p...
- Subscribe to RSS Feed
- Mark Topic as New
- Mark Topic as Read
- Float this Topic for Current User
- Bookmark
- Subscribe
- Printer Friendly Page
- Mark as New
- Bookmark
- Subscribe
- Mute
- Subscribe to RSS Feed
- Permalink
- Report Inappropriate Content
Count instances only if categorised the same for previous 3 months
Hey guys,
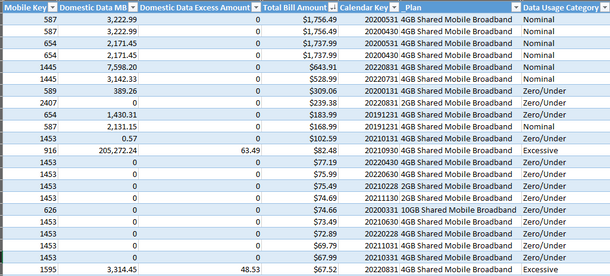
I have the following fact table that records mobile phone billings as at the last day of each month:
The table is connected to a Calendar table and a Mobile Service dim table that contains the details for every mobile service (number, plan type etc,). Each month the individual mobile services are categorised according to their data usage as either being Zero/Under, Excessive, or Nominal as per the Data Use Category column.
I would like to recreate the below stacked bar chart that counts the number of mobile services in the Zero/Under & Excessive categories for the past three months. By this I mean:
- A mobile service will be counted in the Excessive category only if it has been categorised as Excessive for the given month AND the previous 2 months
- A mobile service will be counted in the Zero/Under category only if it has been categorised as Zero/Under for the given month AND the previous 2 months
- The remainder shall be counted as Nominal no matter what their classification for the given and previous 2 months is.
I am going to put this chart in a dashboard that is filterd by a single selection of MM-YY.
To summarise: a mobile service has to be classified as either Zero/Under or Excessive for three consectutive months up to and including the selected month or else it is counted as Nominal.
Any help constructing the neccessary measure(s) to accomplish this would be much appreciated.
Regards,
Steven.
- Mark as New
- Bookmark
- Subscribe
- Mute
- Subscribe to RSS Feed
- Permalink
- Report Inappropriate Content
Hi @Fusion_Tomo,
You can use the following DAX Formula:
Category = IF(CALCULATE(DISTINCTCOUNT('Table'[Data Usage Category],FILTER(DATESINPERIOD('Date'[Date],MAX('Date'[Date]),-3,MONTH)))=1
&& 'Table'[Data Usage Category]<>"Nominal",
MAX('Table'[Data Usage Category]),
"Nominal")
Works for you? Mark this post as a solution if it does!
Consider taking a look at my blog: How to Export Telemetry Data from Azure IoT Central into Power BI
- Mark as New
- Bookmark
- Subscribe
- Mute
- Subscribe to RSS Feed
- Permalink
- Report Inappropriate Content
Thank you for taking the time to respond but that doesn't work - Power BI will not allow me to enter the 'Table'[Data Usage Category]<>"Nominal" condition and I'm not sure the logic of the formula is suited to the problem.


