Don't miss your chance to take exam DP-600 or DP-700 on us!
Request nowLearn from the best! Meet the four finalists headed to the FINALS of the Power BI Dataviz World Championships! Register now
Hi,
I have an SQL DB with 2 tables, Staff & Pay.
There is a Many to one rel-ship based on Staff ID column.
A staff is active or inactive based on their start & end date. If end date is blank then staff is active. If end date is before current day then staff is inactive etc.
Table Pay has a date column that shows every day a staff got paid.
What I need to show is for every Week in Table Pay, the number of staff that were Active in that week but did not get paid i.e they did not work.
I don't even know if this is possible or where to start with this.
Hi @Qotsa,
Could you please mark the proper answers as solutions?
Best Regards,
Hi @Qotsa,
Please download a demo from the attachment. If you have a similar scenario, you can try it out.
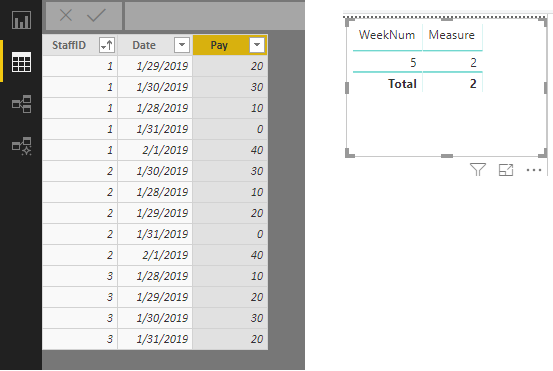
Measure = SUMX ( ADDCOLUMNS ( Staff, "IfNotPaid", IF ( CALCULATE ( COUNTROWS ( Pay ), FILTER ( Pay, Pay[Date] >= MIN ( Staff[Start] ) && Pay[Date] <= IF ( ISBLANK ( Staff[End] ), DATE ( 9999, 12, 31 ), MIN ( Staff[End] ) ) && Pay[Pay] <> 0 && NOT ISBLANK ( Pay[Pay] ) ) ) < 5, 1, 0 ) ), [IfNotPaid] )
Best Regards,
Hello @Qotsa,
would you mind posting a sample of your data set?
thank you
Did I answer your question correctly? Mark my answer as a solution!
Proud to be a Datanaut!
Hi @LivioLanzo,
Thanks for your reply. I'm not sur how I'd even do that except for uploading the whole pbix.
@Qotsa it is possible to post tabular data which can be copy pasted
Did I answer your question correctly? Mark my answer as a solution!
Proud to be a Datanaut!
Share feedback directly with Fabric product managers, participate in targeted research studies and influence the Fabric roadmap.
Check out the February 2026 Power BI update to learn about new features.
| User | Count |
|---|---|
| 53 | |
| 45 | |
| 38 | |
| 16 | |
| 15 |
| User | Count |
|---|---|
| 82 | |
| 71 | |
| 38 | |
| 28 | |
| 25 |