FabCon is coming to Atlanta
Join us at FabCon Atlanta from March 16 - 20, 2026, for the ultimate Fabric, Power BI, AI and SQL community-led event. Save $200 with code FABCOMM.
Register now!- Power BI forums
- Get Help with Power BI
- Desktop
- Service
- Report Server
- Power Query
- Mobile Apps
- Developer
- DAX Commands and Tips
- Custom Visuals Development Discussion
- Health and Life Sciences
- Power BI Spanish forums
- Translated Spanish Desktop
- Training and Consulting
- Instructor Led Training
- Dashboard in a Day for Women, by Women
- Galleries
- Data Stories Gallery
- Themes Gallery
- Contests Gallery
- Quick Measures Gallery
- Notebook Gallery
- Translytical Task Flow Gallery
- TMDL Gallery
- R Script Showcase
- Webinars and Video Gallery
- Ideas
- Custom Visuals Ideas (read-only)
- Issues
- Issues
- Events
- Upcoming Events
To celebrate FabCon Vienna, we are offering 50% off select exams. Ends October 3rd. Request your discount now.
- Power BI forums
- Forums
- Get Help with Power BI
- Desktop
- Count distinct values in one column, grouped by an...
- Subscribe to RSS Feed
- Mark Topic as New
- Mark Topic as Read
- Float this Topic for Current User
- Bookmark
- Subscribe
- Printer Friendly Page
- Mark as New
- Bookmark
- Subscribe
- Mute
- Subscribe to RSS Feed
- Permalink
- Report Inappropriate Content
Count distinct values in one column, grouped by another column
I'm quite new to Power BI and I think this is probably very easy, but I've been trying to work out a solution for several days an I can't work it out.
My data consists of a top-level category (unlimited in number) and a limited set of sub-categories, similar to this:
| Make | Type |
| Ford | SUV |
| Ford | Hatchback |
| Ford | Convertible |
| Ford | Pickup |
| VW | SUV |
| VW | Hatchback |
| Nissan | Pickup |
| Nissan | SUV |
| Nissan | Hatchback |
| Jaguar | Convertible |
| Jaguar | SUV |
I want to add a column that simply shows how many 'types' each manufacturer offers, so the output would be:
| Make | Type | Count of Type |
| Ford | SUV | 4 |
| Ford | Hatchback | 4 |
| Ford | Convertible | 4 |
| Ford | Pickup | 4 |
| VW | SUV | 2 |
| VW | Hatchback | 2 |
| Nissan | Pickup | 3 |
| Nissan | SUV | 3 |
| Nissan | Hatchback | 3 |
| Jaguar | Convertible | 2 |
| Jaguar | SUV | 2 |
as I want to be able to filter on (for example) manufacturers offering more than 2 types of vehicle.
I can create a simple stacked column chart with Make onthe x-axis and Type on the y-axis (with Type as the legend) to get:
but if I filter this visual on 'Count of Type is greater than 2', it shows nothing because for each individual row, the count of Type is 1.
How can I create a column that shows the number of distinct Types by Make, or am I looking at this incorrectly?
Thanks
Solved! Go to Solution.
- Mark as New
- Bookmark
- Subscribe
- Mute
- Subscribe to RSS Feed
- Permalink
- Report Inappropriate Content
HI @Anonymous ,
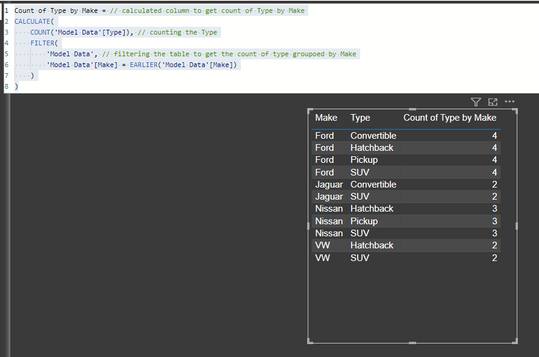
You can create a calculated column in Power BI using the following DAX measure:
Count of Type by Make = // calculated column to get count of Type by Make
CALCULATE(
    COUNT('Model Data'[Type]), // counting the Type
    FILTER(
        'Model Data', // filtering the table to get the count of type groupoed by Make
        'Model Data'[Make] = EARLIER('Model Data'[Make])
    )
)
You will get the result as follows:
Hope this helps.
- Mark as New
- Bookmark
- Subscribe
- Mute
- Subscribe to RSS Feed
- Permalink
- Report Inappropriate Content
I've tried to apply this logic to my requirement, but am returning an error. The difference being that I want to count the number of times an individual item reference appears within a set of data:
| Part No | Date Received |
| CXV1 | 15/02/2024 |
| XC333 | 02/11/2023 |
| XC333 | 01/11/2023 |
| CXV1 | 05/10/2023 |
| ABX123 | 06/09/2023 |
| ABX123 | 04/09/2023 |
| XC333 | 11/06/2023 |
| CXV1 | 31/05/2023 |
| XC333 | 05/05/2023 |
| ABX123 | 01/04/2023 |
| ABX123 | 17/03/2023 |
| CXV1 | 03/03/2023 |
| ABX123 | 02/02/2023 |
I'm receiving an error message:
| DAX comparison operations do not support comparing values of type Text with values of type Integer. Consider using the VALUE or FORMAT function to convert one of the values. |
- Mark as New
- Bookmark
- Subscribe
- Mute
- Subscribe to RSS Feed
- Permalink
- Report Inappropriate Content
HI @Anonymous ,
You can create a calculated column in Power BI using the following DAX measure:
Count of Type by Make = // calculated column to get count of Type by Make
CALCULATE(
    COUNT('Model Data'[Type]), // counting the Type
    FILTER(
        'Model Data', // filtering the table to get the count of type groupoed by Make
        'Model Data'[Make] = EARLIER('Model Data'[Make])
    )
)
You will get the result as follows:
Hope this helps.
- Mark as New
- Bookmark
- Subscribe
- Mute
- Subscribe to RSS Feed
- Permalink
- Report Inappropriate Content
Perfect! Thanks Pragati 😀


