FabCon is coming to Atlanta
Join us at FabCon Atlanta from March 16 - 20, 2026, for the ultimate Fabric, Power BI, AI and SQL community-led event. Save $200 with code FABCOMM.
Register now!- Power BI forums
- Get Help with Power BI
- Desktop
- Service
- Report Server
- Power Query
- Mobile Apps
- Developer
- DAX Commands and Tips
- Custom Visuals Development Discussion
- Health and Life Sciences
- Power BI Spanish forums
- Translated Spanish Desktop
- Training and Consulting
- Instructor Led Training
- Dashboard in a Day for Women, by Women
- Galleries
- Data Stories Gallery
- Themes Gallery
- Contests Gallery
- QuickViz Gallery
- Quick Measures Gallery
- Visual Calculations Gallery
- Notebook Gallery
- Translytical Task Flow Gallery
- TMDL Gallery
- R Script Showcase
- Webinars and Video Gallery
- Ideas
- Custom Visuals Ideas (read-only)
- Issues
- Issues
- Events
- Upcoming Events
Get Fabric Certified for FREE during Fabric Data Days. Don't miss your chance! Request now
- Power BI forums
- Forums
- Get Help with Power BI
- Desktop
- Copying Content of a Matrix to Excel
- Subscribe to RSS Feed
- Mark Topic as New
- Mark Topic as Read
- Float this Topic for Current User
- Bookmark
- Subscribe
- Printer Friendly Page
- Mark as New
- Bookmark
- Subscribe
- Mute
- Subscribe to RSS Feed
- Permalink
- Report Inappropriate Content
Copying Content of a Matrix to Excel
Hi,
I would like to periodically transfer the data of some visuals (matrixes) from Power BI to Excel. For this I am using the export function to CSV. Here I run into the issue that the entire layout is shaken up when loading this CSV into Excel. Now I have solved this for several matrixes by editing with M code in Excel, but the table below is for me next level...
The PBI matrix below is concerned:
Using the M code (without any other adjustments), the import into Excel leads to:
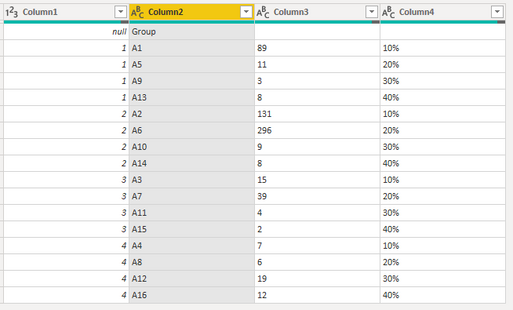
When loading the export CSV into Excel manually invoking the delimiter option, the following comes up:
I have uploaded this CSV file to https://file.io/y27QsPYvaIRu.
However, I would like to see this again as follows in Excel (the name Group upper left is not necessary):
Does anyone have any idea how to get this done with M code?
Thanks in advance for thinking along!
Solved! Go to Solution.
- Mark as New
- Bookmark
- Subscribe
- Mute
- Subscribe to RSS Feed
- Permalink
- Report Inappropriate Content
Hi @MRHUP ,
Please follow the steps below.
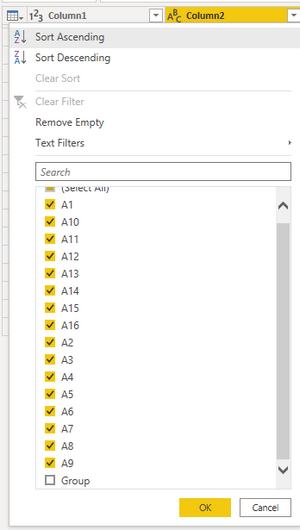
1. Remove the row where "Group" is located.
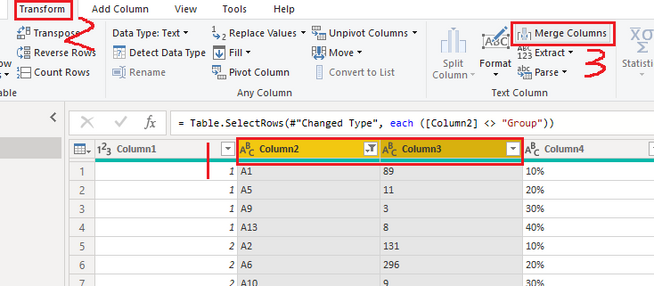
2. Select Column2 and Column3, click "Merge Columns" and set the separator.
3. Select Column4 -> Pivot Column. Then set the [Merged] column as the value and do not aggregate it.
If the problem is still not resolved, please provide detailed error information or the expected result you expect. Let me know immediately, looking forward to your reply.
Best Regards,
Winniz
If this post helps, then please consider Accept it as the solution to help the other members find it more quickly.
- Mark as New
- Bookmark
- Subscribe
- Mute
- Subscribe to RSS Feed
- Permalink
- Report Inappropriate Content
Hi @MRHUP ,
I think using a pivot table in Excel can quickly render the matrix.
Or you can try the following M code.
let
    Source = Table.FromRows(Json.Document(Binary.Decompress(Binary.FromText("XY9LDsMgDAXvgtRdFjEhH5asegiUM6Sq1PvXY6r2qRI80MiMTe8pTen+vF4PP1nn1JP5pRFH9bD59qMrgFtWStnCVmiQw3f50AwlbDHxBt5Q1k3EgW32rGIetPyZ6dQIW0UcdOdxFW/Q+EIR76C8zuKlohG7aAPSXacNaPE5HXdgCu3rPd8=", BinaryEncoding.Base64), Compression.Deflate)), let _t = ((type nullable text) meta [Serialized.Text = true]) in type table [Column1 = _t, Column2 = _t, Column3 = _t, Column4 = _t]),
    #"Changed Type" = Table.TransformColumnTypes(Source,{{"Column1", Int64.Type}, {"Column2", type text}, {"Column3", type text}, {"Column4", type text}}),
    #"Filtered Rows" = Table.SelectRows(#"Changed Type", each ([Column2] <> "Group")),
    #"Merged Columns" = Table.CombineColumns(#"Filtered Rows",{"Column2", "Column3"},Combiner.CombineTextByDelimiter("; ", QuoteStyle.None),"Merged"),
    #"Pivoted Column" = Table.Pivot(Table.TransformColumnTypes(#"Merged Columns", {{"Column4", type text}}, "en-US"), List.Distinct(Table.TransformColumnTypes(#"Merged Columns", {{"Column4", type text}}, "en-US")[Column4]), "Column4", "Merged")
in
    #"Pivoted Column"
If the problem is still not resolved, please provide detailed error information or the expected result you expect. Let me know immediately, looking forward to your reply.
Best Regards,
Winniz
If this post helps, then please consider Accept it as the solution to help the other members find it more quickly.
- Mark as New
- Bookmark
- Subscribe
- Mute
- Subscribe to RSS Feed
- Permalink
- Report Inappropriate Content
Hi @v-kkf-msft ,
This M code works like a charm!!
One question though... How do I alter my original source (is it needed to transform it into this Binary.FromText)? You're using the following statement:
Source = Table.FromRows(Json.Document(Binary.Decompress(Binary.FromText("XY9LDsMgDAXvgtRdFjEhH5asegiUM6Sq1PvXY6r2qRI80MiMTe8pTen+vF4PP1nn1JP5pRFH9bD59qMrgFtWStnCVmiQw3f50AwlbDHxBt5Q1k3EgW32rGIetPyZ6dQIW0UcdOdxFW/Q+EIR76C8zuKlohG7aAPSXacNaPE5HXdgCu3rPd8=", BinaryEncoding.Base64), Compression.Deflate)), let _t = ((type nullable text) meta [Serialized.Text = true]) in type table [Column1 = _t, Column2 = _t, Column3 = _t, Column4 = _t]),In my code, the source is described as:
let
Source = Csv.Document(File.Contents("\\Ad.gaz.net\wws\\200430\dash\Dashboord2\1.1 Counts).csv"),[Delimiter=",", Columns=4, Encoding=65001, QuoteStyle=QuoteStyle.Csv]),
I've tried, but I can't reproduce the same result with the CSV as source as your code... Can you help me with this? It looks like a small issue?
- Mark as New
- Bookmark
- Subscribe
- Mute
- Subscribe to RSS Feed
- Permalink
- Report Inappropriate Content
Hi @MRHUP ,
Please follow the steps below.
1. Remove the row where "Group" is located.
2. Select Column2 and Column3, click "Merge Columns" and set the separator.
3. Select Column4 -> Pivot Column. Then set the [Merged] column as the value and do not aggregate it.
If the problem is still not resolved, please provide detailed error information or the expected result you expect. Let me know immediately, looking forward to your reply.
Best Regards,
Winniz
If this post helps, then please consider Accept it as the solution to help the other members find it more quickly.
- Mark as New
- Bookmark
- Subscribe
- Mute
- Subscribe to RSS Feed
- Permalink
- Report Inappropriate Content
Hi @v-kkf-msft ,
Thank you very much for your detailed explanation and effort! Everything is working perfectly now!
Helpful resources

Power BI Monthly Update - November 2025
Check out the November 2025 Power BI update to learn about new features.

Fabric Data Days
Advance your Data & AI career with 50 days of live learning, contests, hands-on challenges, study groups & certifications and more!


