FabCon is coming to Atlanta
Join us at FabCon Atlanta from March 16 - 20, 2026, for the ultimate Fabric, Power BI, AI and SQL community-led event. Save $200 with code FABCOMM.
Register now!- Power BI forums
- Get Help with Power BI
- Desktop
- Service
- Report Server
- Power Query
- Mobile Apps
- Developer
- DAX Commands and Tips
- Custom Visuals Development Discussion
- Health and Life Sciences
- Power BI Spanish forums
- Translated Spanish Desktop
- Training and Consulting
- Instructor Led Training
- Dashboard in a Day for Women, by Women
- Galleries
- Data Stories Gallery
- Themes Gallery
- Contests Gallery
- QuickViz Gallery
- Quick Measures Gallery
- Visual Calculations Gallery
- Notebook Gallery
- Translytical Task Flow Gallery
- TMDL Gallery
- R Script Showcase
- Webinars and Video Gallery
- Ideas
- Custom Visuals Ideas (read-only)
- Issues
- Issues
- Events
- Upcoming Events
The Power BI Data Visualization World Championships is back! Get ahead of the game and start preparing now! Learn more
- Power BI forums
- Forums
- Get Help with Power BI
- Desktop
- Converting static to Dynamic Measure
- Subscribe to RSS Feed
- Mark Topic as New
- Mark Topic as Read
- Float this Topic for Current User
- Bookmark
- Subscribe
- Printer Friendly Page
- Mark as New
- Bookmark
- Subscribe
- Mute
- Subscribe to RSS Feed
- Permalink
- Report Inappropriate Content
Converting static to Dynamic Measure
Hai All,
I am expecting a super solution for this requirement.
The requirement is Currently I am working on a sales dashboard and every year this report is having different versions of tables for eg
V5-May-2021, V6-June-2021 To V1 Jan-2022, and it goes so every month user will share the new version of data with the same schema.
If the schema is following the same schema I am using the append option. But The problem is after appending every time with a new version I want to change my version static value with a new version name like this
so every time I want to change this measure manually with the new version
My requirement is instead of this static method how can I achieve this solution as dynamically
for eg (Instead of writing every time a new version name in this dax if I have another measure that contains an updated version so I can mention that here)
Note. this table has a column (version) and it consists of different versions of the table which appended
Solved! Go to Solution.
- Mark as New
- Bookmark
- Subscribe
- Mute
- Subscribe to RSS Feed
- Permalink
- Report Inappropriate Content
Hi @Anonymous
Please try something like
Measure1 =
VAR LastDateWithData =
    CALCULATE ( MAX ( MASTER[Date] ), REMOVEFILTERS () )
VAR LastVerion =
    CALCULATE (
        MAX ( MASTER[Version] ),
        MASTER[Date] = LastDateWithData,
        REMOVEFILTERS ()
    )
RETURN
    CALCULATE (
        SUM ( Sales[Values] ) / 1000,
        MASTER[Version] = LastVerion,
        ALL ( MASTER[Comparison] )
)- Mark as New
- Bookmark
- Subscribe
- Mute
- Subscribe to RSS Feed
- Permalink
- Report Inappropriate Content
Hai @tamerj1
This solution is not working , can i create two table for version?
- Mark as New
- Bookmark
- Subscribe
- Mute
- Subscribe to RSS Feed
- Permalink
- Report Inappropriate Content
@Anonymous
I don't know how your data and data model look like.
- Mark as New
- Bookmark
- Subscribe
- Mute
- Subscribe to RSS Feed
- Permalink
- Report Inappropriate Content
Hai @tamerj1
This is the data model master table contains all dimension values and the sales table is a fact table
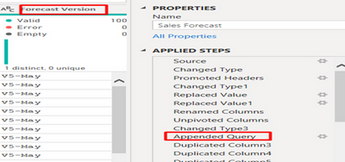
This is the fact table here I will append every version of data in this particular table, I have a data of V5- May -2021 to v4- April-2022
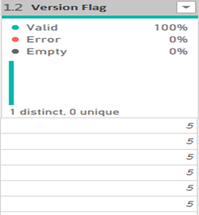
After I had created a version flag so based on this report will understand the max of version
And user want to see the report based on the latest version of data and they want to compare it with previous ones
Requirment is , After appedning every version table instead of write a static latest version(like which i marked in red)
I want to add dynamic latest version. And report should automatically update with latest version.Even the new version of table appending
Hope it clear please reach out still you have any doubt
- Mark as New
- Bookmark
- Subscribe
- Mute
- Subscribe to RSS Feed
- Permalink
- Report Inappropriate Content
Good morning @Anonymous
this is exactly what I was trying to do. Her is the explanation of my idea and let me know if anything does not seem right.
The latest verion corresponds to the latest date available in the MASTER table. I started with calculating the last date avialable in the master table by removing all filters.
using this date I calculated the corresponding version and again by removing all filters.
this should give me the last version which I can refer to in your measure. Not sure wht goes wrong? Please correct me if I missed something.
- Mark as New
- Bookmark
- Subscribe
- Mute
- Subscribe to RSS Feed
- Permalink
- Report Inappropriate Content
Hai @tamerj1
Can you suggest some other way based on version
and
please guide this i am trying to solve through this
I am trying to create a calculated column based max of forecast version column based on max version flag. but this is showing wrong
version flag represnts number of each version
- Mark as New
- Bookmark
- Subscribe
- Mute
- Subscribe to RSS Feed
- Permalink
- Report Inappropriate Content
Hi @Anonymous
can we connected on zoom or teams now? I can share a link in private message
- Mark as New
- Bookmark
- Subscribe
- Mute
- Subscribe to RSS Feed
- Permalink
- Report Inappropriate Content
.
- Mark as New
- Bookmark
- Subscribe
- Mute
- Subscribe to RSS Feed
- Permalink
- Report Inappropriate Content
I shareda link
- Mark as New
- Bookmark
- Subscribe
- Mute
- Subscribe to RSS Feed
- Permalink
- Report Inappropriate Content
- Mark as New
- Bookmark
- Subscribe
- Mute
- Subscribe to RSS Feed
- Permalink
- Report Inappropriate Content
- Mark as New
- Bookmark
- Subscribe
- Mute
- Subscribe to RSS Feed
- Permalink
- Report Inappropriate Content
@Anonymous
Try delete FILTER (
- Mark as New
- Bookmark
- Subscribe
- Mute
- Subscribe to RSS Feed
- Permalink
- Report Inappropriate Content
You need to indicate to Power Query how the tables should be sorted. For example by extracting the date from the table name and then using the table with the latest date as the master.
Please provide sanitized sample data that fully covers your issue. If you paste the data into a table in your post or use one of the file services it will be easier to assist you. I cannot use screenshots of your source data.
Please show the expected outcome based on the sample data you provided. Screenshots of the expected outcome are ok.
https://community.powerbi.com/t5/Desktop/How-to-Get-Your-Question-Answered-Quickly/m-p/1447523
Helpful resources

Power BI Dataviz World Championships
The Power BI Data Visualization World Championships is back! Get ahead of the game and start preparing now!

| User | Count |
|---|---|
| 41 | |
| 37 | |
| 35 | |
| 35 | |
| 28 |
| User | Count |
|---|---|
| 134 | |
| 101 | |
| 71 | |
| 67 | |
| 65 |


