Forum Discussion
Anonymous
4 years agoNot applicable
Convert matrix table to clustered column chart
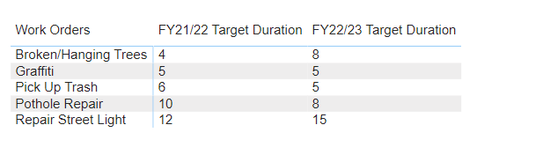
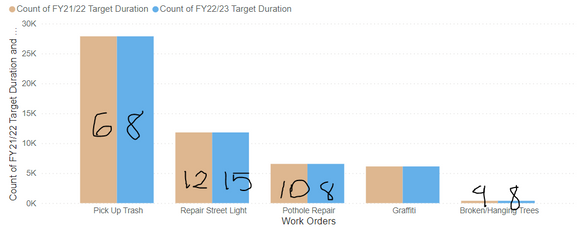
Hello, I'd like to set up a clustered column chart to show the changes in target duration from this current fiscal year compared to the previous fiscal year. There are 5 work order cat...
- 4 years ago
You can either:
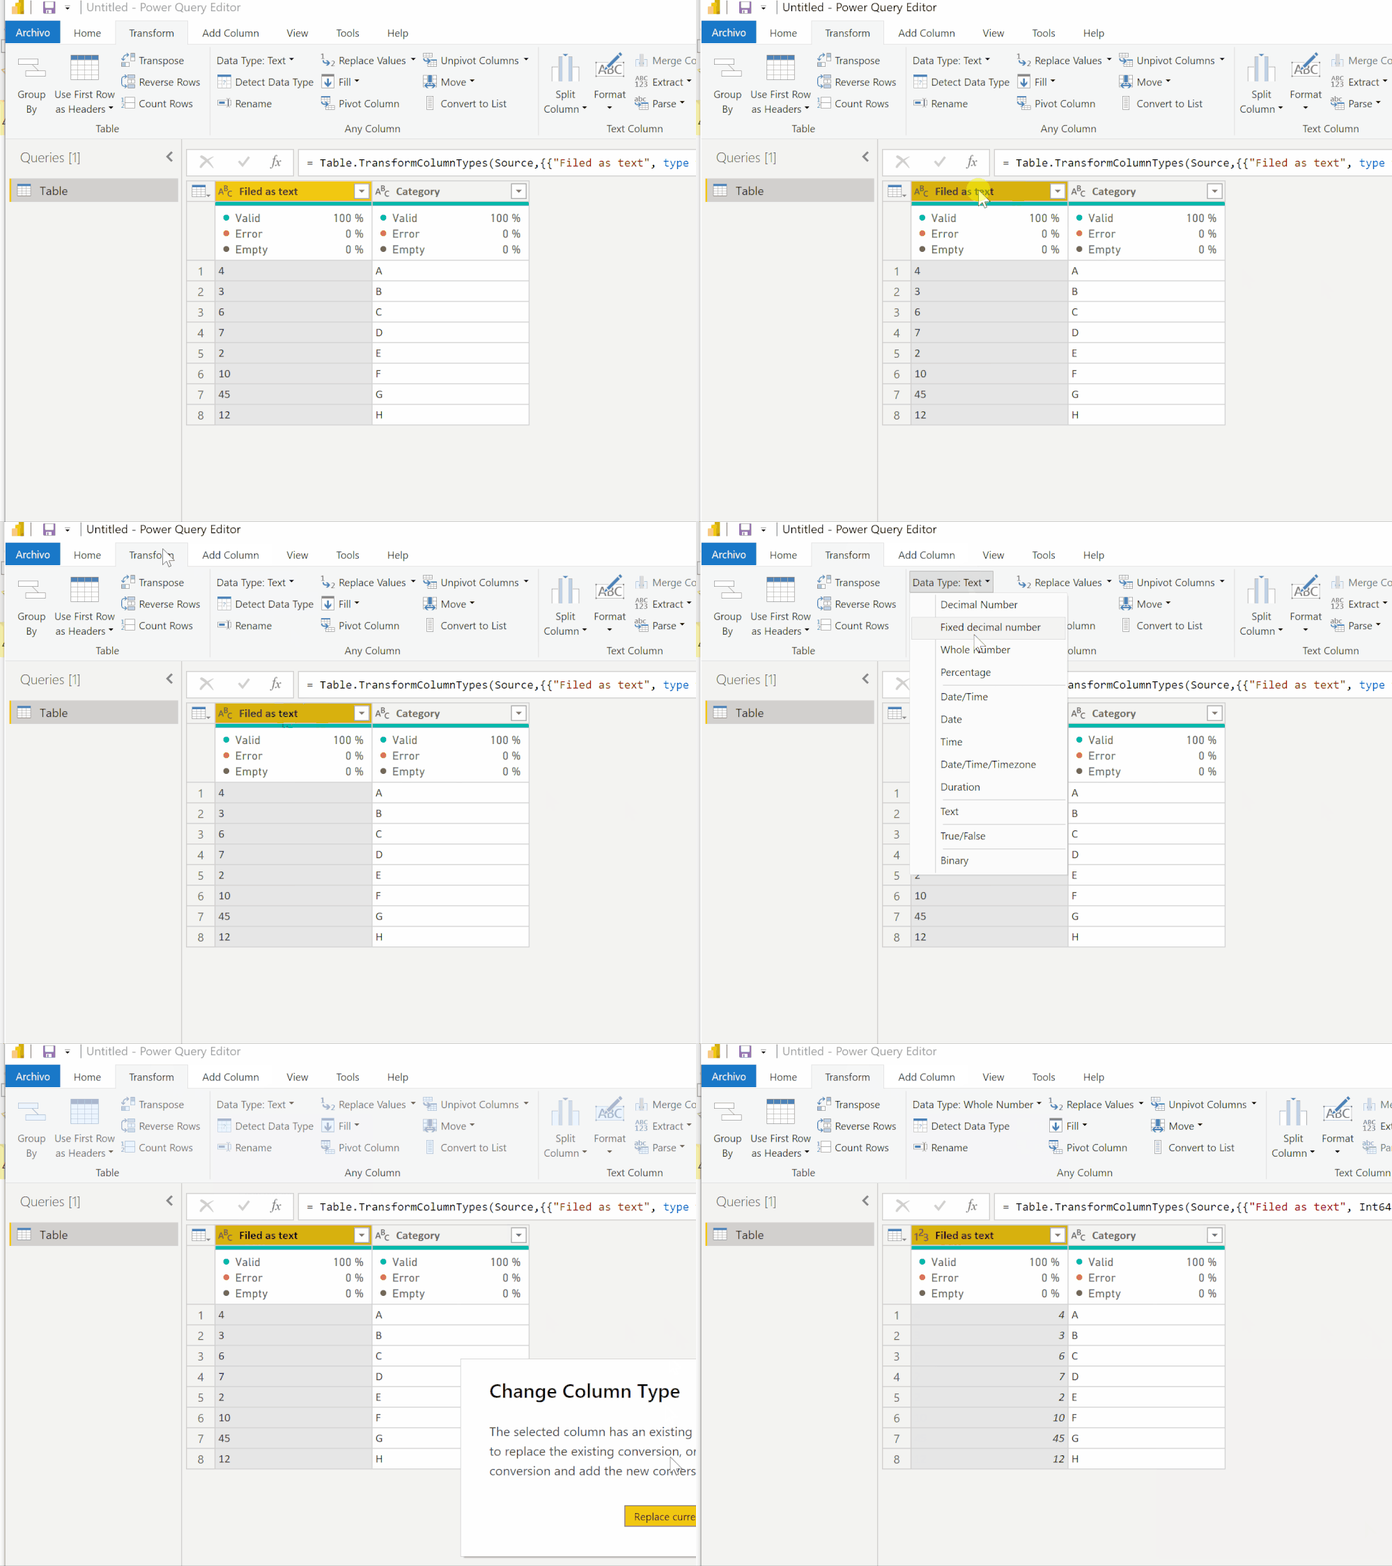
a) Change the field type in Power Query or table view to whole number
b) if you need the values as text for other purposes, you can convert the text field to a number using a measure:
Text as number measure = VALUE(MAX('Table'[Filed as text]))
PaulDBrown
Community Champion
4 years agoYou can either:
a) Change the field type in Power Query or table view to whole number
b) if you need the values as text for other purposes, you can convert the text field to a number using a measure:
Text as number measure =
VALUE(MAX('Table'[Filed as text]))
Anonymous
4 years agoNot applicable
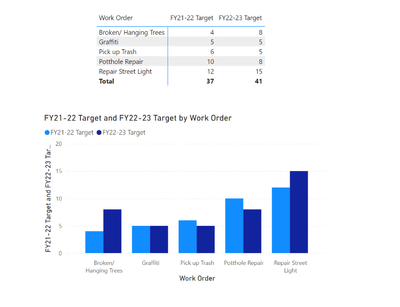
Thank you! That worked perfectly. I had tried to change the data type to a whole number previously in my data table, but I guess I had to change it directly from power query.