Join us at FabCon Vienna from September 15-18, 2025
The ultimate Fabric, Power BI, SQL, and AI community-led learning event. Save €200 with code FABCOMM.
Get registered- Power BI forums
- Get Help with Power BI
- Desktop
- Service
- Report Server
- Power Query
- Mobile Apps
- Developer
- DAX Commands and Tips
- Custom Visuals Development Discussion
- Health and Life Sciences
- Power BI Spanish forums
- Translated Spanish Desktop
- Training and Consulting
- Instructor Led Training
- Dashboard in a Day for Women, by Women
- Galleries
- Data Stories Gallery
- Themes Gallery
- Contests Gallery
- Quick Measures Gallery
- Notebook Gallery
- Translytical Task Flow Gallery
- TMDL Gallery
- R Script Showcase
- Webinars and Video Gallery
- Ideas
- Custom Visuals Ideas (read-only)
- Issues
- Issues
- Events
- Upcoming Events
Enhance your career with this limited time 50% discount on Fabric and Power BI exams. Ends September 15. Request your voucher.
- Power BI forums
- Forums
- Get Help with Power BI
- Desktop
- Connecting 3 different columns with different data
- Subscribe to RSS Feed
- Mark Topic as New
- Mark Topic as Read
- Float this Topic for Current User
- Bookmark
- Subscribe
- Printer Friendly Page
- Mark as New
- Bookmark
- Subscribe
- Mute
- Subscribe to RSS Feed
- Permalink
- Report Inappropriate Content
Connecting 3 different columns with different data
Hello
I am trying to connect 3 different tables so that i can view data in a single bargraph.
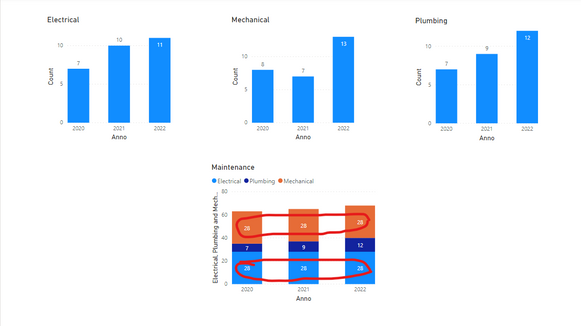
I am trying to have the maintenance graph for yearly data. All the 3 tables have different dates, different status. There is no common link between them. I tried to visualise them in a single barhraph and this is the endresult.
For plumbing its shows correct yearly data (break down for 3 years) and others its simply repeating the cumulative count of 3 years insteadd of yearly data (i believe its because i took date from Plumbing which is not related to Mechnaical and Electrical).
I tried to create link between the due dates and it didn't work.
I have uploaded the file here https://www.dropbox.com/s/4hbo3viq2sleij2/Maintenance.pbix?dl=0
Thanks in advance
Bishnu
Solved! Go to Solution.
- Mark as New
- Bookmark
- Subscribe
- Mute
- Subscribe to RSS Feed
- Permalink
- Report Inappropriate Content
Looking at the structure of the table, I would suggest you append the tables.
https://radacad.com/append-vs-merge-in-power-bi-and-power-query
Another way is to create common dimensions for the date, Type and Review Status and join them with these tables. And then analyze the data
- Mark as New
- Bookmark
- Subscribe
- Mute
- Subscribe to RSS Feed
- Permalink
- Report Inappropriate Content
Helpful resources
| User | Count |
|---|---|
| 68 | |
| 63 | |
| 59 | |
| 54 | |
| 28 |
| User | Count |
|---|---|
| 182 | |
| 81 | |
| 64 | |
| 46 | |
| 41 |


