Get certified for free when you join Fabric Data Days 2026 and dive into Fabric, Power BI, SQL, AI, and other essential data skills.
Join nowJuly 7 - July 17 | Round 2 of the Power BI Dataviz World Championships. Don't miss your chance! Learn more
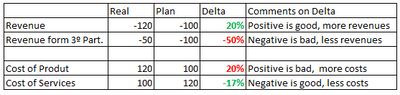
I have a Financial Statment matrix that compare Real vs Plan in Revenues and Cost. In my Financial Statement Revenues are negative and Costs Positive.
I've also a column, Delta, that divide Actual Values by Plan Values as bellow (this was done in Excel):
How can I format the Column Delta with the right colours depending if is Revenue or Cost?
Thanks in advanced
Solved! Go to Solution.
@Anonymous
Hi, you can use a measure to evaluate the positive/negative and the Type (Revenue or Cost)
ColorFormat =
IF (
SEARCH ( "REVENUE"; SELECTEDVALUE ( 'Table'[Type] ),, 0 ) <> 0,
IF ( [Delta] > 0, "#008000", "#ff0000" ),
IF ( [Delta] > 0, "#ff0000", "#008000" )
)
After that In Conditional Formatting, Select Format By Field Value--Based on Field - ColorFormat
Regards
Victor
@Anonymous
Hi, you can use a measure to evaluate the positive/negative and the Type (Revenue or Cost)
ColorFormat =
IF (
SEARCH ( "REVENUE"; SELECTEDVALUE ( 'Table'[Type] ),, 0 ) <> 0,
IF ( [Delta] > 0, "#008000", "#ff0000" ),
IF ( [Delta] > 0, "#ff0000", "#008000" )
)
After that In Conditional Formatting, Select Format By Field Value--Based on Field - ColorFormat
Regards
Victor
Join us in Barcelona for FabCon and SQLCon, the Fabric, Power BI, SQL, and AI community event. Save €200 with code FABCMTY200.
Join Fabric Data Days 2026: 60 days of free live/on-demand sessions, challenges, study groups, and certification opportunities.
| User | Count |
|---|---|
| 27 | |
| 24 | |
| 18 | |
| 14 | |
| 14 |
| User | Count |
|---|---|
| 65 | |
| 41 | |
| 40 | |
| 39 | |
| 39 |