New Offer! Become a Certified Fabric Data Engineer
Check your eligibility for this 50% exam voucher offer and join us for free live learning sessions to get prepared for Exam DP-700.
Get Started- Power BI forums
- Get Help with Power BI
- Desktop
- Service
- Report Server
- Power Query
- Mobile Apps
- Developer
- DAX Commands and Tips
- Custom Visuals Development Discussion
- Health and Life Sciences
- Power BI Spanish forums
- Translated Spanish Desktop
- Training and Consulting
- Instructor Led Training
- Dashboard in a Day for Women, by Women
- Galleries
- Community Connections & How-To Videos
- COVID-19 Data Stories Gallery
- Themes Gallery
- Data Stories Gallery
- R Script Showcase
- Webinars and Video Gallery
- Quick Measures Gallery
- 2021 MSBizAppsSummit Gallery
- 2020 MSBizAppsSummit Gallery
- 2019 MSBizAppsSummit Gallery
- Events
- Ideas
- Custom Visuals Ideas
- Issues
- Issues
- Events
- Upcoming Events
Don't miss out! 2025 Microsoft Fabric Community Conference, March 31 - April 2, Las Vegas, Nevada. Use code MSCUST for a $150 discount. Prices go up February 11th. Register now.
- Power BI forums
- Forums
- Get Help with Power BI
- Desktop
- Re: Complex DAX: Contracted and Uncontracted Reven...
- Subscribe to RSS Feed
- Mark Topic as New
- Mark Topic as Read
- Float this Topic for Current User
- Bookmark
- Subscribe
- Printer Friendly Page
- Mark as New
- Bookmark
- Subscribe
- Mute
- Subscribe to RSS Feed
- Permalink
- Report Inappropriate Content
Complex DAX: Contracted and Uncontracted Revenue - single Row value across multiple months (Help!)
Hello all,
HELP ME! 😞
I am stuck on a problem that I can't get me head around and need the help of a super Power BI guru.
I have an example table below. In my model it is called AgreementAdditions and List:
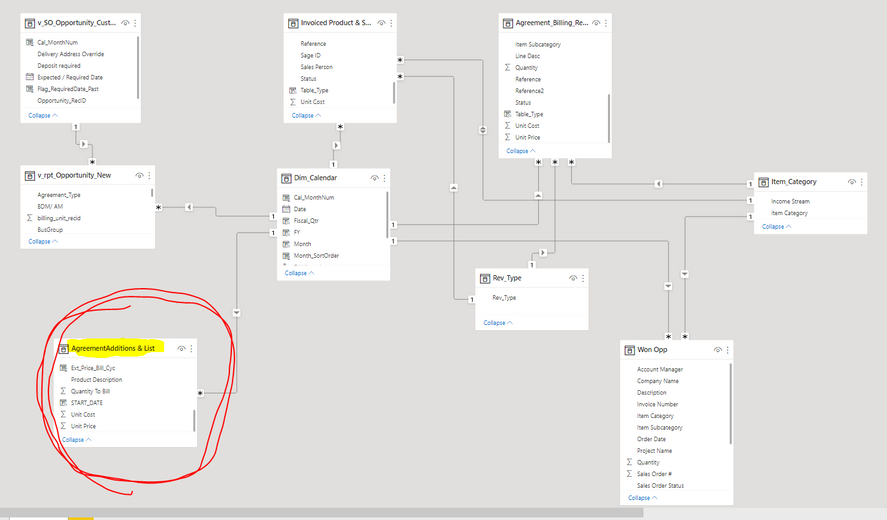
Below is the relationship model and I have circled where the AgreementAdditions and List table is:
The Goal is i'm tryiong to acheive the below results in a table visual format (but I need it to work in other visual formats too like bar chart or something like that):
I have created the above 2 tables as an example, so as you can see what I want is the Revenue (Ext Price) in the AgreementAdditons and List table to be spread out across multiple months (depending on the start and end date).
If there is no end date then the value should continue as contracted. If there is an end date then the value stops in said month, but in the following month continues as Uncontracted.
Also I want there to be dynamic filtering available, so if I select FY22-23 or FY23-24, I will see different results (as per above example).
So far I have achived the following:
The table viz above is created as follows:
In the data relationship model you will see a table called: Rev_Type. This is what I use as Rows in the table viz:
I have yet to add Pipeline, Contracted and Uncontracted_Weighted (80%) in the above table
The TOTAL_RS! in values is a DAX calc:
TOTAL_RS1 = SUM(Agreement_Billing_Report[Extended Price]) + CALCULATE(SUM('Invoiced Product & Subscription'[Extended Price]),'Invoiced Product & Subscription'[Income Stream] = "RS1 - Contracts") + SUM(Opportunity[Ext Price])
Each component of this calc results in a Row in the table viz (i.e. Agreement, SO).
SUM(Opportunity[Ext Price] will result in Pipeline row but this has not yet been populated.
I am looking to add more components to the above calc so I can eveventually have Contratced, Uncontraced and Uncontracted_Weighted.
If you have a better way of doing this I am open to all solutions 🙂
Ypur help will be most appreciated and I am always availablle to give you more details to help you so you can help me 🙂
Many, many thanks in advance. And good luck!
Kind regards,
Sabil
😊
Solved! Go to Solution.
- Mark as New
- Bookmark
- Subscribe
- Mute
- Subscribe to RSS Feed
- Permalink
- Report Inappropriate Content
Hello,
This issue has now been resolved. I used a CROSSJOIN between revenue contracts table and Calendar table. I then used SUMMARIZE to group the rows per month per year OR per StartofMonth date.
See below:
Thanks for getting back to me though.
- Mark as New
- Bookmark
- Subscribe
- Mute
- Subscribe to RSS Feed
- Permalink
- Report Inappropriate Content
Hi @sabilahmed
Thanks for reaching out to us.
Can you share your sample files or sample data that fully covers your needs? Thanks.
Best Regards,
Community Support Team _Tang
If this post helps, please consider Accept it as the solution to help the other members find it more quickly.
- Mark as New
- Bookmark
- Subscribe
- Mute
- Subscribe to RSS Feed
- Permalink
- Report Inappropriate Content
Hello,
This issue has now been resolved. I used a CROSSJOIN between revenue contracts table and Calendar table. I then used SUMMARIZE to group the rows per month per year OR per StartofMonth date.
See below:
Thanks for getting back to me though.
- Mark as New
- Bookmark
- Subscribe
- Mute
- Subscribe to RSS Feed
- Permalink
- Report Inappropriate Content
@amitchandak Hi Amit, sorry to approach you like this, is it possible you can help me with this? Cheers 🙂
Helpful resources
| User | Count |
|---|---|
| 123 | |
| 76 | |
| 62 | |
| 50 | |
| 49 |
| User | Count |
|---|---|
| 175 | |
| 125 | |
| 60 | |
| 60 | |
| 58 |


