FabCon is coming to Atlanta
Join us at FabCon Atlanta from March 16 - 20, 2026, for the ultimate Fabric, Power BI, AI and SQL community-led event. Save $200 with code FABCOMM.
Register now!- Power BI forums
- Get Help with Power BI
- Desktop
- Service
- Report Server
- Power Query
- Mobile Apps
- Developer
- DAX Commands and Tips
- Custom Visuals Development Discussion
- Health and Life Sciences
- Power BI Spanish forums
- Translated Spanish Desktop
- Training and Consulting
- Instructor Led Training
- Dashboard in a Day for Women, by Women
- Galleries
- Data Stories Gallery
- Themes Gallery
- Contests Gallery
- QuickViz Gallery
- Quick Measures Gallery
- Visual Calculations Gallery
- Notebook Gallery
- Translytical Task Flow Gallery
- TMDL Gallery
- R Script Showcase
- Webinars and Video Gallery
- Ideas
- Custom Visuals Ideas (read-only)
- Issues
- Issues
- Events
- Upcoming Events
The Power BI Data Visualization World Championships is back! Get ahead of the game and start preparing now! Learn more
- Power BI forums
- Forums
- Get Help with Power BI
- Desktop
- Re: Comparing values to previous months
- Subscribe to RSS Feed
- Mark Topic as New
- Mark Topic as Read
- Float this Topic for Current User
- Bookmark
- Subscribe
- Printer Friendly Page

- Mark as New
- Bookmark
- Subscribe
- Mute
- Subscribe to RSS Feed
- Permalink
- Report Inappropriate Content
Comparing values to previous months
Hi,
I am wondering whether it is possible to achieve this and display as a table.

I have a table that displays client number by month. I then want to add new measures that calculates the difference to Apr of that year, difference to last month, 6 months and 12 months ago as shown above.
I have created a new measure that calculates if a date falls in one of the above categories and flag is if true. I then add a new measure that calculates the difference such as for 12 months ago:
Solved! Go to Solution.


- Mark as New
- Bookmark
- Subscribe
- Mute
- Subscribe to RSS Feed
- Permalink
- Report Inappropriate Content
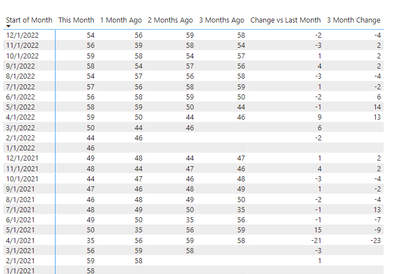
Please see the attached sample file. You would not need to create a measure for every month; just for the relative month.
- Mark as New
- Bookmark
- Subscribe
- Mute
- Subscribe to RSS Feed
- Permalink
- Report Inappropriate Content
Hello - yes, it is possible to recreate the values shown in your screensnip. It would be best if you have a separate date table that is related to your data table. Then you would have the separate measures that reference the dates in the date table. Below are sample scripts for measures along with the url for the associated DAX pattern, which includes detailed explanations and scripts for a date table that you can just copy and paste into your project. For the scripts below, just replace the table and column references with the applicable table and column names for your project. For each measure, you can change the number of months to offset from current, which is shown as -1 (for prior month) in the example.
Add a column to your table 'Year Month Number' to reference in your . This will be in the format of yyyyMM and will be for the date of the current row (not the date for any previous period).
https://www.daxpatterns.com/month-related-calculations/
# Users
Users :=
DISTINCTCOUNT('PBI all'[Service user ID])
Prior Month
Users PM :=
VAR CurrentYearMonthNumber = SELECTEDVALUE ( 'Date'[Year Month Number] )
VAR PreviousYearMonthNumber = CurrentYearMonthNumber - 1
VAR Result =
    CALCULATE (
        [Users],
        REMOVEFILTERS ( 'Date' ),
        'Date'[Year Month Number] = PreviousYearMonthNumber
    )
RETURN
    Result
- Mark as New
- Bookmark
- Subscribe
- Mute
- Subscribe to RSS Feed
- Permalink
- Report Inappropriate Content
Hi @jennratten,
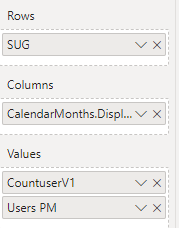
I have tried your method and still not getting the result i want. I have created a new date table from the link you have provided and then created a new measure below:
- Mark as New
- Bookmark
- Subscribe
- Mute
- Subscribe to RSS Feed
- Permalink
- Report Inappropriate Content
In order to have all of this shown on one table, you will need to either create measures for all of the values to be included in the table or create a calculated table that produces the desired results and then add all to the visual. Calculations should be dynamic so you won't have to update them for specific dates, like CurrentValue-1Mo, CurrentValue-2Mo, CurrentValue-3Mo, ChangeVs12Mo, ChangeVs6Mo, etc.
Please let me know if I can further assist.
- Mark as New
- Bookmark
- Subscribe
- Mute
- Subscribe to RSS Feed
- Permalink
- Report Inappropriate Content
Just to confirm, do you mean i would need to create measures for each month, Apr, May, Jun etc as well as diff to Apr, diff to previous months, 6 months and 12 months?
Are you able to give me an example?
kind regards
Hetal
- Mark as New
- Bookmark
- Subscribe
- Mute
- Subscribe to RSS Feed
- Permalink
- Report Inappropriate Content
- Mark as New
- Bookmark
- Subscribe
- Mute
- Subscribe to RSS Feed
- Permalink
- Report Inappropriate Content
Thank you very much for this.

- Mark as New
- Bookmark
- Subscribe
- Mute
- Subscribe to RSS Feed
- Permalink
- Report Inappropriate Content
@Anonymous , create your measure and then with help from time intelligence have measure like
Year behind Sales = CALCULATE([Measure],dateadd('Date'[Date],-1,Year))
6 Months behind Sales = CALCULATE([Measure],dateadd('Date'[Date],-6,Month))
Time Intelligence, DATESMTD, DATESQTD, DATESYTD, Week On Week, Week Till Date, Custom Period on Period,
Custom Period till date: https://youtu.be/aU2aKbnHuWs&t=145s
Helpful resources

Power BI Monthly Update - November 2025
Check out the November 2025 Power BI update to learn about new features.

Fabric Data Days
Advance your Data & AI career with 50 days of live learning, contests, hands-on challenges, study groups & certifications and more!

FabCon Atlanta 2026
Join us at FabCon Atlanta, March 16-20, for the ultimate Fabric, Power BI, AI and SQL community-led event. Save $200 with code FABCOMM.

| User | Count |
|---|---|
| 57 | |
| 43 | |
| 40 | |
| 21 | |
| 17 |


| User | Count |
|---|---|
| 171 | |
| 104 | |
| 92 | |
| 44 | |
| 44 |


