FabCon is coming to Atlanta
Join us at FabCon Atlanta from March 16 - 20, 2026, for the ultimate Fabric, Power BI, AI and SQL community-led event. Save $200 with code FABCOMM.
Register now!- Power BI forums
- Get Help with Power BI
- Desktop
- Service
- Report Server
- Power Query
- Mobile Apps
- Developer
- DAX Commands and Tips
- Custom Visuals Development Discussion
- Health and Life Sciences
- Power BI Spanish forums
- Translated Spanish Desktop
- Training and Consulting
- Instructor Led Training
- Dashboard in a Day for Women, by Women
- Galleries
- Data Stories Gallery
- Themes Gallery
- Contests Gallery
- QuickViz Gallery
- Quick Measures Gallery
- Visual Calculations Gallery
- Notebook Gallery
- Translytical Task Flow Gallery
- TMDL Gallery
- R Script Showcase
- Webinars and Video Gallery
- Ideas
- Custom Visuals Ideas (read-only)
- Issues
- Issues
- Events
- Upcoming Events
The Power BI Data Visualization World Championships is back! Get ahead of the game and start preparing now! Learn more
- Power BI forums
- Forums
- Get Help with Power BI
- Desktop
- Compare two columns in different tables
- Subscribe to RSS Feed
- Mark Topic as New
- Mark Topic as Read
- Float this Topic for Current User
- Bookmark
- Subscribe
- Printer Friendly Page
- Mark as New
- Bookmark
- Subscribe
- Mute
- Subscribe to RSS Feed
- Permalink
- Report Inappropriate Content
Compare two columns in different tables
Hi, I have two disconnected tables (no relationship) that I want to compare.
I want to have a slicer to choose the week of comparison.
Actual table and Forcast table. I want to have a view like on the right of the picture below.
Any help is appreciated!
- Mark as New
- Bookmark
- Subscribe
- Mute
- Subscribe to RSS Feed
- Permalink
- Report Inappropriate Content
Hi,
Add a column in each Table with the title of Type. The entries in this column should be Actual and Budget. Append the 2 tables. Select all columns other than the Year columns, right click and select "Unpivot Other Columns". Create a matrix visual - add manager and Role to rows, Type and Attribute to columns. Write this measure
measure = sum(Data[Value])
Hope this helps.
Regards,
Ashish Mathur
http://www.ashishmathur.com
https://www.linkedin.com/in/excelenthusiasts/
- Mark as New
- Bookmark
- Subscribe
- Mute
- Subscribe to RSS Feed
- Permalink
- Report Inappropriate Content
Hi @KimRexh ,
Here are the steps you can follow:
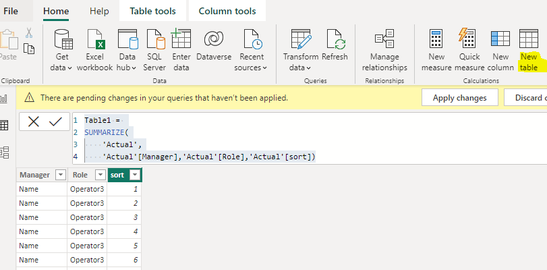
1. Create calculated table.
Table1 =
SUMMARIZE(
    'Actual',
    'Actual'[Manager],'Actual'[Role],'Actual'[sort])
2. Create measure.
Measure1 =
SUMX(
    FILTER(ALL(Actual),
    'Actual'[sort]=MAX('Table1'[sort])),[1944])
Measure2 =
SUMX(
FILTER(ALL('Forecast'),
'Forecast'[sort]=MAX('Table1'[sort])),[1944])Flag =
IF(
[Measure1]<>[Measure2],1,0)Result:
3. Create slicers with column headers.
Right-click Copy Actual Table in Power Query to form a new Copy:
Select all columns of Copy Table – Transform – Unpivot columns.
Click [Vlaue] – Remove Columns.
Select [Attribute] – Right-click – Remove Duplicates.
Best Regards,
Liu Yang
If this post helps, then please consider Accept it as the solution to help the other members find it more quickly
- Mark as New
- Bookmark
- Subscribe
- Mute
- Subscribe to RSS Feed
- Permalink
- Report Inappropriate Content
Thank you for your solution. So doing it this way I set the 1944 column static right?
What I would like, and I could have made it more clear in the desc. is I would like to compare all values (1944 (YYWW) goes from 2019-today) with two slicers.
Like this;
- Mark as New
- Bookmark
- Subscribe
- Mute
- Subscribe to RSS Feed
- Permalink
- Report Inappropriate Content
Hi @KimRexh ,
You can use "Merge Queries as new" and then add a conditional column like below for comparision:
After clicking OK, Expand ->
Select columns ->
Now, add a conditional column ->
Comparision = if(Merge1Forecast] = Merge1[Actual], 0, 1)
Result:
- Mark as New
- Bookmark
- Subscribe
- Mute
- Subscribe to RSS Feed
- Permalink
- Report Inappropriate Content
Thank you for your reply!
When I do this I get a new row for each row when I expand the table with columns from table2.
Also, I have tried creating field parameters for the columns so that I can create a slicer for the columns but is there a alternative way of creating slicer with column header?
- Mark as New
- Bookmark
- Subscribe
- Mute
- Subscribe to RSS Feed
- Permalink
- Report Inappropriate Content
@KimRexh , a better way is to create common dimensions and use those
Power BI- DAX: When I asked you to create common tables: https://youtu.be/a2CrqCA9geM
Power BI- Power Query: When I asked you to create common tables: https://youtu.be/PqfGW6pl1Sw
Helpful resources

Power BI Monthly Update - November 2025
Check out the November 2025 Power BI update to learn about new features.

Fabric Data Days
Advance your Data & AI career with 50 days of live learning, contests, hands-on challenges, study groups & certifications and more!

| User | Count |
|---|---|
| 58 | |
| 43 | |
| 42 | |
| 23 | |
| 17 |
| User | Count |
|---|---|
| 190 | |
| 121 | |
| 96 | |
| 65 | |
| 46 |


