Get certified for free when you join Fabric Data Days 2026 and dive into Fabric, Power BI, SQL, AI, and other essential data skills.
Join nowJuly 7 - July 17 | Round 2 of the Power BI Dataviz World Championships. Don't miss your chance! Learn more
Hi.
I have Date on X-Axis
On Y Axis i have Count of Items
On the line going across I want it to portray count of 1 of 4 possible items.
When i use that filter - the Count of items goes down to the count of 1/2/3/4, I ant Count of Items to be a constant.
Some more details will help to understand your issue. Could you please sahre some sample data with expected output?
Thanks
Raj
Hi Raj.
Thanks for your reply.
So when i select the option in Page Level filter or Report Level filter (tried both)
Both values decrease.
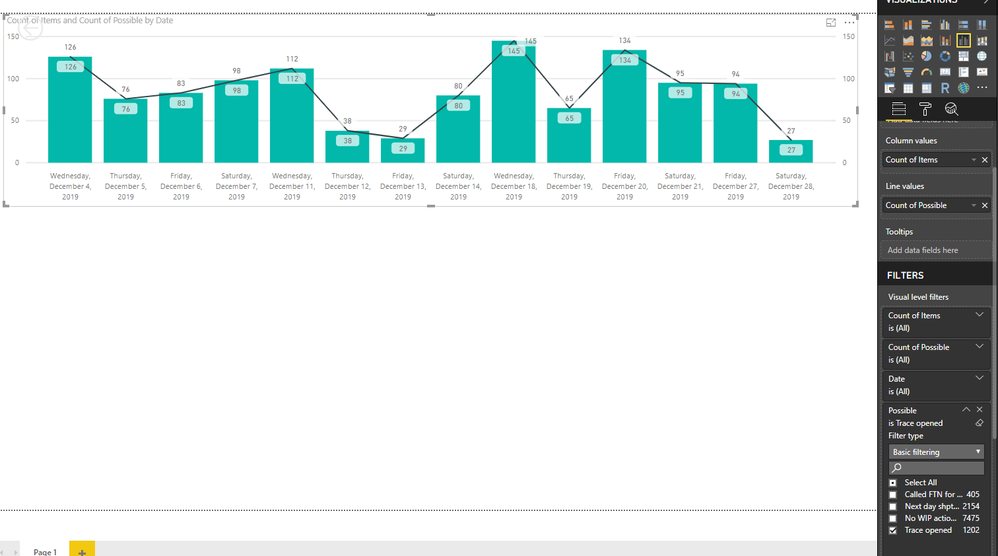
I want the column value to be a constant and the line value to fluctuate depending on the option i choose.
Hope this makes this clearer.
Picture 1 is with all items selected.
Picture 2 is with one of the option only.
I want the Column in picture 2 to remain like in Picture 1.
Whilst the line is "dynamic"
Hi @Dauan ,
Sorry for the delay.
If it is convenient, could you share some data sample which could reproduce your scenario so that I could copy and test in my site.
Best Regards,
Cherry
Join us in Barcelona for FabCon and SQLCon, the Fabric, Power BI, SQL, and AI community event. Save €200 with code FABCMTY200.
Check out the July 2026 Power BI update to learn about new features.
Join Data Days 2026: 60 days of free live/on-demand sessions, challenges, study groups, and certification opportunities.
| User | Count |
|---|---|
| 30 | |
| 25 | |
| 23 | |
| 22 | |
| 13 |
| User | Count |
|---|---|
| 50 | |
| 33 | |
| 21 | |
| 20 | |
| 17 |