Hello,
I've created a few measures to calculate a metric showing the prior year and a trailing last year (from the last completed month). However, when I go to visualize these, using a visual level filter doesn't limit the data correctly on one of the measures.
Here are the 2 measures:
Cost Per Pound Prior Year = CALCULATE([Cost Per Pound],USERELATIONSHIP('tms_dw aym_invoiced_all'[master date],DateKey[Date]),DATEADD(DateKey[Date],-12,month))
Cost Per Pound Last Year Rolling = CALCULATE([Cost Per Pound],USERELATIONSHIP('tms_dw aym_invoiced_all'[master date],DateKey[Date]),DATESINPERIOD(DateKey[Date],EOMONTH(lastdate(DateKey[Date]),-1),-12,month))
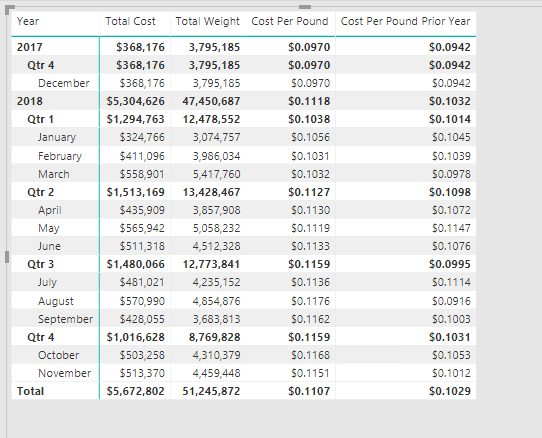
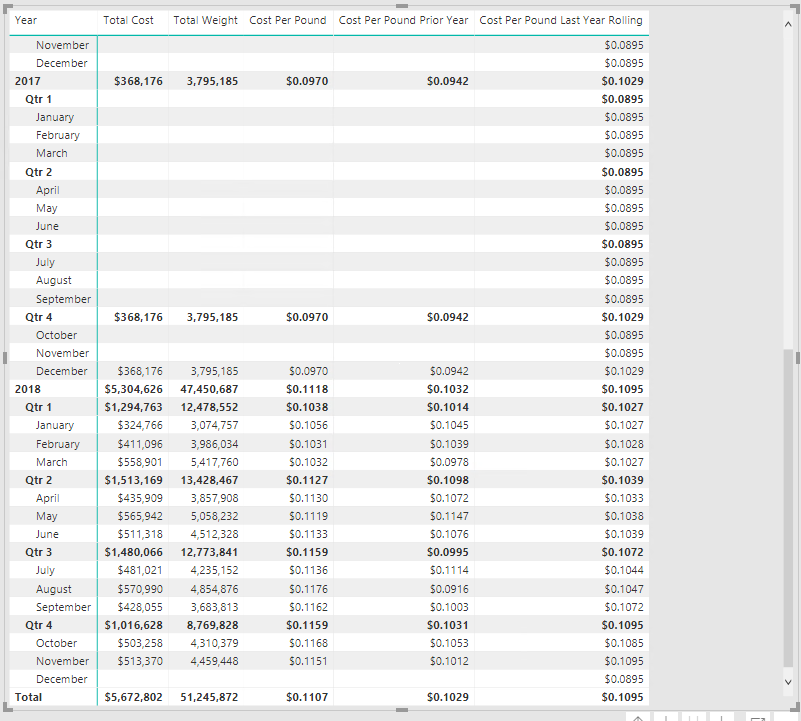
Here is the result:
If I only include the Cost Per Pound Prior Year metric, then I can apply the visual level filter to only show the last 12 calendar months (using the DateKey[Date] field). However, if I include both, then the visual level filter doesn't properly filter.
Any help would be greatly appreciated.
Seth


