Get certified for free when you join Fabric Data Days 2026 and dive into Fabric, Power BI, SQL, AI, and other essential data skills.
Join nowJuly 28 - August 9 | Final Round of the Power BI Dataviz World Championships. This is your chance. Learn more
Hi,
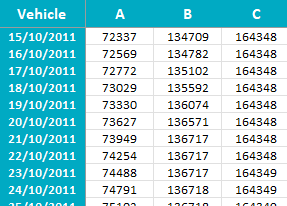
I have a table in Excel (to be imported into Power Bi) which has dates down one side (running from January 2010 to way into the future)
My columns are vehicles A, B and C (but over 100 of them) and the date within the spreadsheet is cumulative miles
I'm looking at creating a new table which will show me the daily miles instead so A would show 232 which is the difference between 15th and 16th
Does anyone know of a way to do this please?
Solved! Go to Solution.
Firstly I would recommend you Unpivot the Vehicle columns.
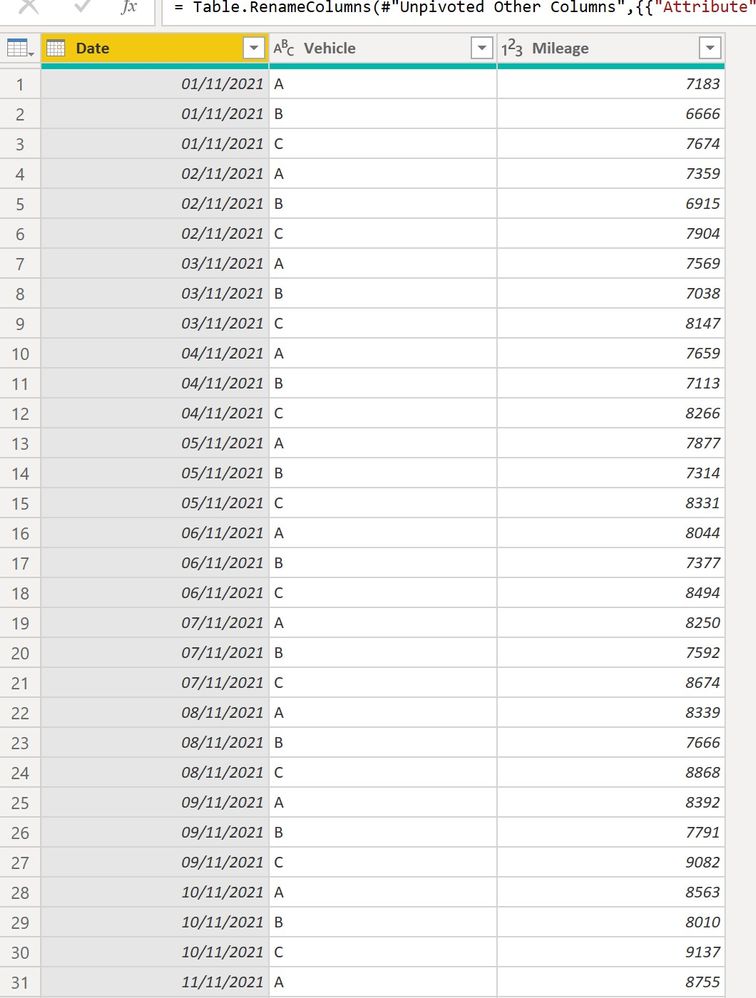
You can then create a calculated column to get the daily mileage for each vehicle using:
Daily Mileage =
VAR PrevDate =
CALCULATE (
SUM ( 'DataTable'[Mileage] ),
FILTER (
'DataTable',
'DataTable'[Vehicle] = EARLIER ( 'DataTable'[Vehicle] )
&& 'DataTable'[Date]
= EARLIER ( 'DataTable'[Date] ) - 1
)
)
VAR CurrDate =
CALCULATE (
SUM ( 'DataTable'[Mileage] ),
FILTER (
'DataTable',
'DataTable'[Vehicle] = EARLIER ( 'DataTable'[Vehicle] )
&& 'DataTable'[Date] = EARLIER ( 'DataTable'[Date] )
)
)
RETURN
CurrDate - PrevDate
To get:
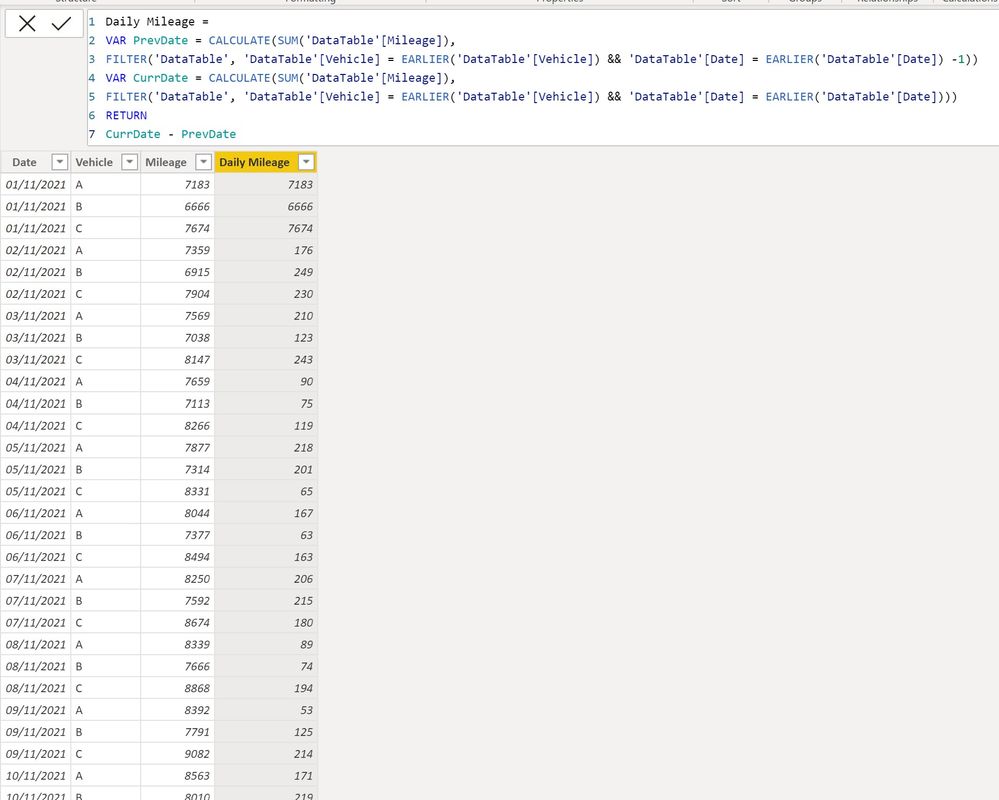
If you want the "Daily Mileage" for the first (minimum) date to be blank, use:
Daily Mileage =
VAR MinDate =
MIN ( 'DataTable'[Date] )
VAR PrevDate =
CALCULATE (
SUM ( 'DataTable'[Mileage] ),
FILTER (
'DataTable',
'DataTable'[Vehicle] = EARLIER ( 'DataTable'[Vehicle] )
&& 'DataTable'[Date]
= EARLIER ( 'DataTable'[Date] ) - 1
)
)
VAR CurrDate =
CALCULATE (
SUM ( 'DataTable'[Mileage] ),
FILTER (
'DataTable',
'DataTable'[Vehicle] = EARLIER ( 'DataTable'[Vehicle] )
&& 'DataTable'[Date] = EARLIER ( 'DataTable'[Date] )
)
)
RETURN
IF ( 'DataTable'[Date] = MinDate, BLANK (), CurrDate - PrevDate )
I've attached the sample PBIX file
Proud to be a Super User!
Paul on Linkedin.
Firstly I would recommend you Unpivot the Vehicle columns.
You can then create a calculated column to get the daily mileage for each vehicle using:
Daily Mileage =
VAR PrevDate =
CALCULATE (
SUM ( 'DataTable'[Mileage] ),
FILTER (
'DataTable',
'DataTable'[Vehicle] = EARLIER ( 'DataTable'[Vehicle] )
&& 'DataTable'[Date]
= EARLIER ( 'DataTable'[Date] ) - 1
)
)
VAR CurrDate =
CALCULATE (
SUM ( 'DataTable'[Mileage] ),
FILTER (
'DataTable',
'DataTable'[Vehicle] = EARLIER ( 'DataTable'[Vehicle] )
&& 'DataTable'[Date] = EARLIER ( 'DataTable'[Date] )
)
)
RETURN
CurrDate - PrevDate
To get:
If you want the "Daily Mileage" for the first (minimum) date to be blank, use:
Daily Mileage =
VAR MinDate =
MIN ( 'DataTable'[Date] )
VAR PrevDate =
CALCULATE (
SUM ( 'DataTable'[Mileage] ),
FILTER (
'DataTable',
'DataTable'[Vehicle] = EARLIER ( 'DataTable'[Vehicle] )
&& 'DataTable'[Date]
= EARLIER ( 'DataTable'[Date] ) - 1
)
)
VAR CurrDate =
CALCULATE (
SUM ( 'DataTable'[Mileage] ),
FILTER (
'DataTable',
'DataTable'[Vehicle] = EARLIER ( 'DataTable'[Vehicle] )
&& 'DataTable'[Date] = EARLIER ( 'DataTable'[Date] )
)
)
RETURN
IF ( 'DataTable'[Date] = MinDate, BLANK (), CurrDate - PrevDate )
I've attached the sample PBIX file
Proud to be a Super User!
Paul on Linkedin.
does exactly as I needed - thanks for this 👍
please provide sample data and expected result for the issue
Join us in Barcelona for FabCon and SQLCon, the Fabric, Power BI, SQL, and AI community event. Save €200 with code FABCMTY200.
If you love stickers, then you will definitely want to check out our community sticker challenge, Barcelona edition!
Check out the July 2026 Power BI update to learn about new features.
| User | Count |
|---|---|
| 30 | |
| 28 | |
| 22 | |
| 21 | |
| 19 |
| User | Count |
|---|---|
| 44 | |
| 32 | |
| 18 | |
| 17 | |
| 17 |