Join us at the 2025 Microsoft Fabric Community Conference
March 31 - April 2, 2025, in Las Vegas, Nevada. Use code MSCUST for a $150 discount! Early bird discount ends December 31.
Register Now- Power BI forums
- Get Help with Power BI
- Desktop
- Service
- Report Server
- Power Query
- Mobile Apps
- Developer
- DAX Commands and Tips
- Custom Visuals Development Discussion
- Health and Life Sciences
- Power BI Spanish forums
- Translated Spanish Desktop
- Training and Consulting
- Instructor Led Training
- Dashboard in a Day for Women, by Women
- Galleries
- Community Connections & How-To Videos
- COVID-19 Data Stories Gallery
- Themes Gallery
- Data Stories Gallery
- R Script Showcase
- Webinars and Video Gallery
- Quick Measures Gallery
- 2021 MSBizAppsSummit Gallery
- 2020 MSBizAppsSummit Gallery
- 2019 MSBizAppsSummit Gallery
- Events
- Ideas
- Custom Visuals Ideas
- Issues
- Issues
- Events
- Upcoming Events
Be one of the first to start using Fabric Databases. View on-demand sessions with database experts and the Microsoft product team to learn just how easy it is to get started. Watch now
- Power BI forums
- Forums
- Get Help with Power BI
- Desktop
- Calculate a previous level missing
- Subscribe to RSS Feed
- Mark Topic as New
- Mark Topic as Read
- Float this Topic for Current User
- Bookmark
- Subscribe
- Printer Friendly Page
- Mark as New
- Bookmark
- Subscribe
- Mute
- Subscribe to RSS Feed
- Permalink
- Report Inappropriate Content
Calculate a previous level missing
Hi ,
Need help to calculate "missing rows".
I have a table :
| Region | Country | Product | Week | Quantity |
| APAC | Australia | X | 1 | 10 |
| APAC | Australia | Y | 1 | 12 |
| APAC | Australia | Z | 1 | 32 |
| APAC | Japan | X | 1 | 7 |
| APAC | Hong Kong | X | 1 | 4 |
| APAC | Hong Kong | Y | 1 | 13 |
| APAC | Hong Kong | Z | 1 | 15 |
The goal is to add missing rows for each country,product,week.
in the example i need to add rows for country Japan the missing products (Y,Z)
The quantity will be summerize quantity of Region by product,week
| Region | Country | Product | Week | Quantity |
| APAC | Australia | X | 1 | .10 |
| APAC | Australia | Y | 1 | 12 |
| APAC | Australia | Z | 1 | 32 |
| APAC | Japan | X | 1 | 7 |
| APAC | Japan | Y | 1 | 25 (12 + 13) |
| APAC | Japan | Z | 1 | 47 (32+15) |
Solved! Go to Solution.
- Mark as New
- Bookmark
- Subscribe
- Mute
- Subscribe to RSS Feed
- Permalink
- Report Inappropriate Content
Hi @RsimonAlign
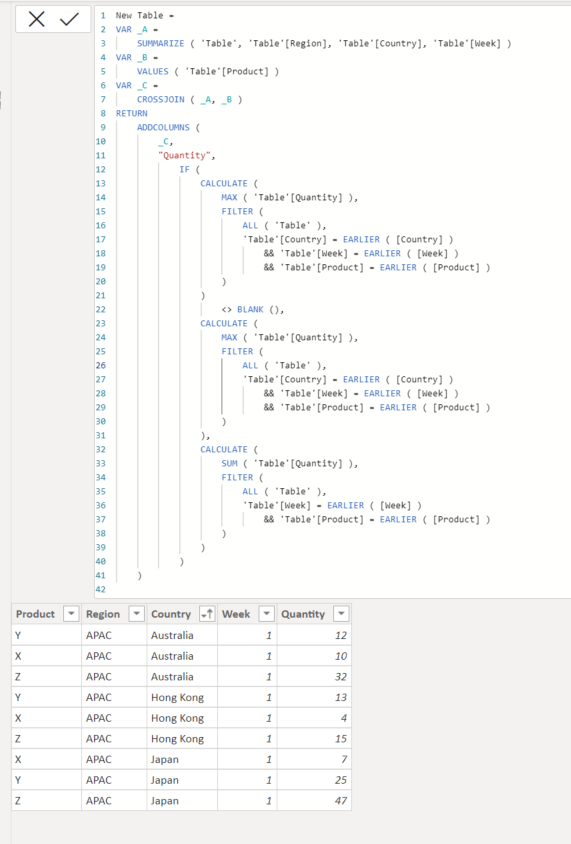
Try this code to add a new table:
New Table =
VAR _A =
    SUMMARIZE ( 'Table', 'Table'[Region], 'Table'[Country], 'Table'[Week] )
VAR _B =
    VALUES ( 'Table'[Product] )
VAR _C =
    CROSSJOIN ( _A, _B )
RETURN
    ADDCOLUMNS (
        _C,
        "Quantity",
            IF (
                CALCULATE (
                    MAX ( 'Table'[Quantity] ),
                    FILTER (
                        ALL ( 'Table' ),
                        'Table'[Country] = EARLIER ( [Country] )
                            && 'Table'[Week] = EARLIER ( [Week] )
                            && 'Table'[Product] = EARLIER ( [Product] )
                    )
                )
                    <> BLANK (),
                CALCULATE (
                    MAX ( 'Table'[Quantity] ),
                    FILTER (
                        ALL ( 'Table' ),
                        'Table'[Country] = EARLIER ( [Country] )
                            && 'Table'[Week] = EARLIER ( [Week] )
                            && 'Table'[Product] = EARLIER ( [Product] )
                    )
                ),
                CALCULATE (
                    SUM ( 'Table'[Quantity] ),
                    FILTER (
                        ALL ( 'Table' ),
                        'Table'[Week] = EARLIER ( [Week] )
                            && 'Table'[Product] = EARLIER ( [Product] )
                    )
                )
            )
    )
Output:
If this post helps, please consider accepting it as the solution to help the other members find it more quickly.
Appreciate your Kudos!!
LinkedIn: www.linkedin.com/in/vahid-dm/
Helpful resources

Join us at the Microsoft Fabric Community Conference
March 31 - April 2, 2025, in Las Vegas, Nevada. Use code MSCUST for a $150 discount!

Microsoft Fabric Community Conference 2025
Arun Ulag shares exciting details about the Microsoft Fabric Conference 2025, which will be held in Las Vegas, NV.

| User | Count |
|---|---|
| 114 | |
| 76 | |
| 57 | |
| 52 | |
| 44 |
| User | Count |
|---|---|
| 164 | |
| 116 | |
| 63 | |
| 57 | |
| 50 |


