Join us at FabCon Vienna from September 15-18, 2025
The ultimate Fabric, Power BI, SQL, and AI community-led learning event. Save €200 with code FABCOMM.
Get registered- Power BI forums
- Get Help with Power BI
- Desktop
- Service
- Report Server
- Power Query
- Mobile Apps
- Developer
- DAX Commands and Tips
- Custom Visuals Development Discussion
- Health and Life Sciences
- Power BI Spanish forums
- Translated Spanish Desktop
- Training and Consulting
- Instructor Led Training
- Dashboard in a Day for Women, by Women
- Galleries
- Data Stories Gallery
- Themes Gallery
- Contests Gallery
- Quick Measures Gallery
- Notebook Gallery
- Translytical Task Flow Gallery
- TMDL Gallery
- R Script Showcase
- Webinars and Video Gallery
- Ideas
- Custom Visuals Ideas (read-only)
- Issues
- Issues
- Events
- Upcoming Events
Enhance your career with this limited time 50% discount on Fabric and Power BI exams. Ends August 31st. Request your voucher.
- Power BI forums
- Forums
- Get Help with Power BI
- Desktop
- Re: Calculate Average based on time filter selecte...
- Subscribe to RSS Feed
- Mark Topic as New
- Mark Topic as Read
- Float this Topic for Current User
- Bookmark
- Subscribe
- Printer Friendly Page
- Mark as New
- Bookmark
- Subscribe
- Mute
- Subscribe to RSS Feed
- Permalink
- Report Inappropriate Content
Calculate Average based on time filter selected
Hi
I have 6 months' worth of data ranging from Jan to Jun 2019 (below is a sample of the dataset). I am trying to create average measure (daily/weekly/monthly excluding weekends) for the count of IDs. Ideally these averages should change if I select different time periods. But my average measures don't seem to work well. As I select a different time, say Jan and Feb, the daily average I got is not exactly daily average between Jan and Feb. What I got is the total daily averages of Jan and Feb
Eg: Daily average of IDs count
Jan 1000
Feb 2000
--> daily average I want should be (1000+2000)/2 = 1500. But what I got is 3000
Any guidance would be appreciated!
Thanks
- Mark as New
- Bookmark
- Subscribe
- Mute
- Subscribe to RSS Feed
- Permalink
- Report Inappropriate Content
@Anonymous ,
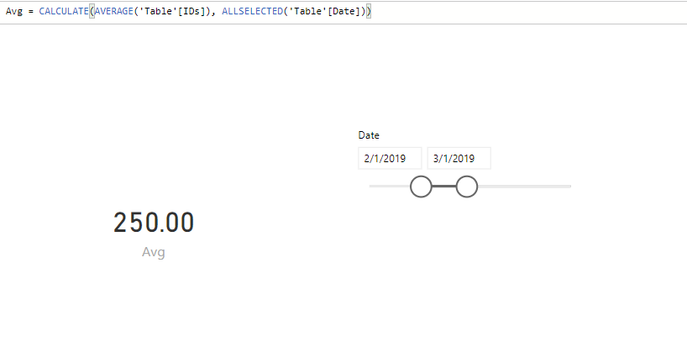
You can create a measure using dax below:
Avg = CALCULATE(AVERAGE('Table'[IDs]), ALLSELECTED('Table'[Date]))

Community Support Team _ Jimmy Tao
If this post helps, then please consider Accept it as the solution to help the other members find it more quickly.
- Mark as New
- Bookmark
- Subscribe
- Mute
- Subscribe to RSS Feed
- Permalink
- Report Inappropriate Content
Thanks for getting back @v-yuta-msft !
I want to exclude weekends from my average calculation. Will that function work in that case ?
- Mark as New
- Bookmark
- Subscribe
- Mute
- Subscribe to RSS Feed
- Permalink
- Report Inappropriate Content
I should probably rephrase my problem to make it clearer @v-yuta-msft
My original dataset includes transactions settled during business days only (we call it settle dates)
Following instructions from other post, I create a calendar table and build daily/weekly/monthly average measures based on the count of work days in that calendar. These measure work well if they stand alone but will break if I put in a time slicer. Will very much appreciate any help


