Reply
JMSNYC
Helper III
Helper III

Bubble Chart and DAX Calculation

Hi.


I cannot figure out the way to build a bubble chart based on this data set, where 


1- x-axis should be the total actual office visits for ANY given customer (i.e. sum column 2)

2- y-axis should be the total planned office visits for ANY given customer (i.e. sum column 3)

3- bubble size is the number of customers that have the same (x,y) combination, e.g., 3 actual, 3 planned


Customer_IDMonthly_office_visitMonthly_office_planned
111
212
323
424
531
632
713
822
922
1022
133
234
311
212
323
424
531
232
413


Could anyone please help ?


Thanks

1 ACCEPTED SOLUTION
Sean
Community Champion
Community Champion

@JMSNYC

Start by creating these 3 Measures and 1 Column


Visits = SUM ( 'Table'[Monthly_office_visit] )

Planned = SUM ( 'Table'[Monthly_office_planned] )

Size Column =
DIVIDE (
CALCULATE ( [Visits], ALLEXCEPT ( 'Table', 'Table'[Customer_ID] ) ),
CALCULATE ( [Planned], ALLEXCEPT ( 'Table', 'Table'[Customer_ID] ) ),
0
)

Size Measure =
CALCULATE (
DISTINCTCOUNT ( 'Table'[Customer_ID] ),
ALLEXCEPT ( 'Table', 'Table'[Size Column] )
)

Then create your bubble chart like this...


Bubble Chart - 2018-09-14.png


Hope this helps! Smiley Happy

View solution in original post

3 REPLIES 3
Sean
Community Champion
Community Champion

@JMSNYC

Start by creating these 3 Measures and 1 Column


Visits = SUM ( 'Table'[Monthly_office_visit] )

Planned = SUM ( 'Table'[Monthly_office_planned] )

Size Column =
DIVIDE (
CALCULATE ( [Visits], ALLEXCEPT ( 'Table', 'Table'[Customer_ID] ) ),
CALCULATE ( [Planned], ALLEXCEPT ( 'Table', 'Table'[Customer_ID] ) ),
0
)

Size Measure =
CALCULATE (
DISTINCTCOUNT ( 'Table'[Customer_ID] ),
ALLEXCEPT ( 'Table', 'Table'[Size Column] )
)

Then create your bubble chart like this...


Bubble Chart - 2018-09-14.png


Hope this helps! Smiley Happy

Awesome. Works perfectly.

Hi Sean.


Thank you for your quick answer that already helped. I have an incremental question on metrics #3, though. Could you please further help?


Size should be the VOLUME of customers for ANY given pair (planned,visit), i.e. if 41 customers have 2 visits planned and 2 actual vists, then size of bubble should be 41, if 23 customers have 1 visit planned and 3 actual visits, then size of bubble should be 23, etc.


I used 


size = distinctcount(customer_id) ... but when plotted, I got homogeneous bubbles.


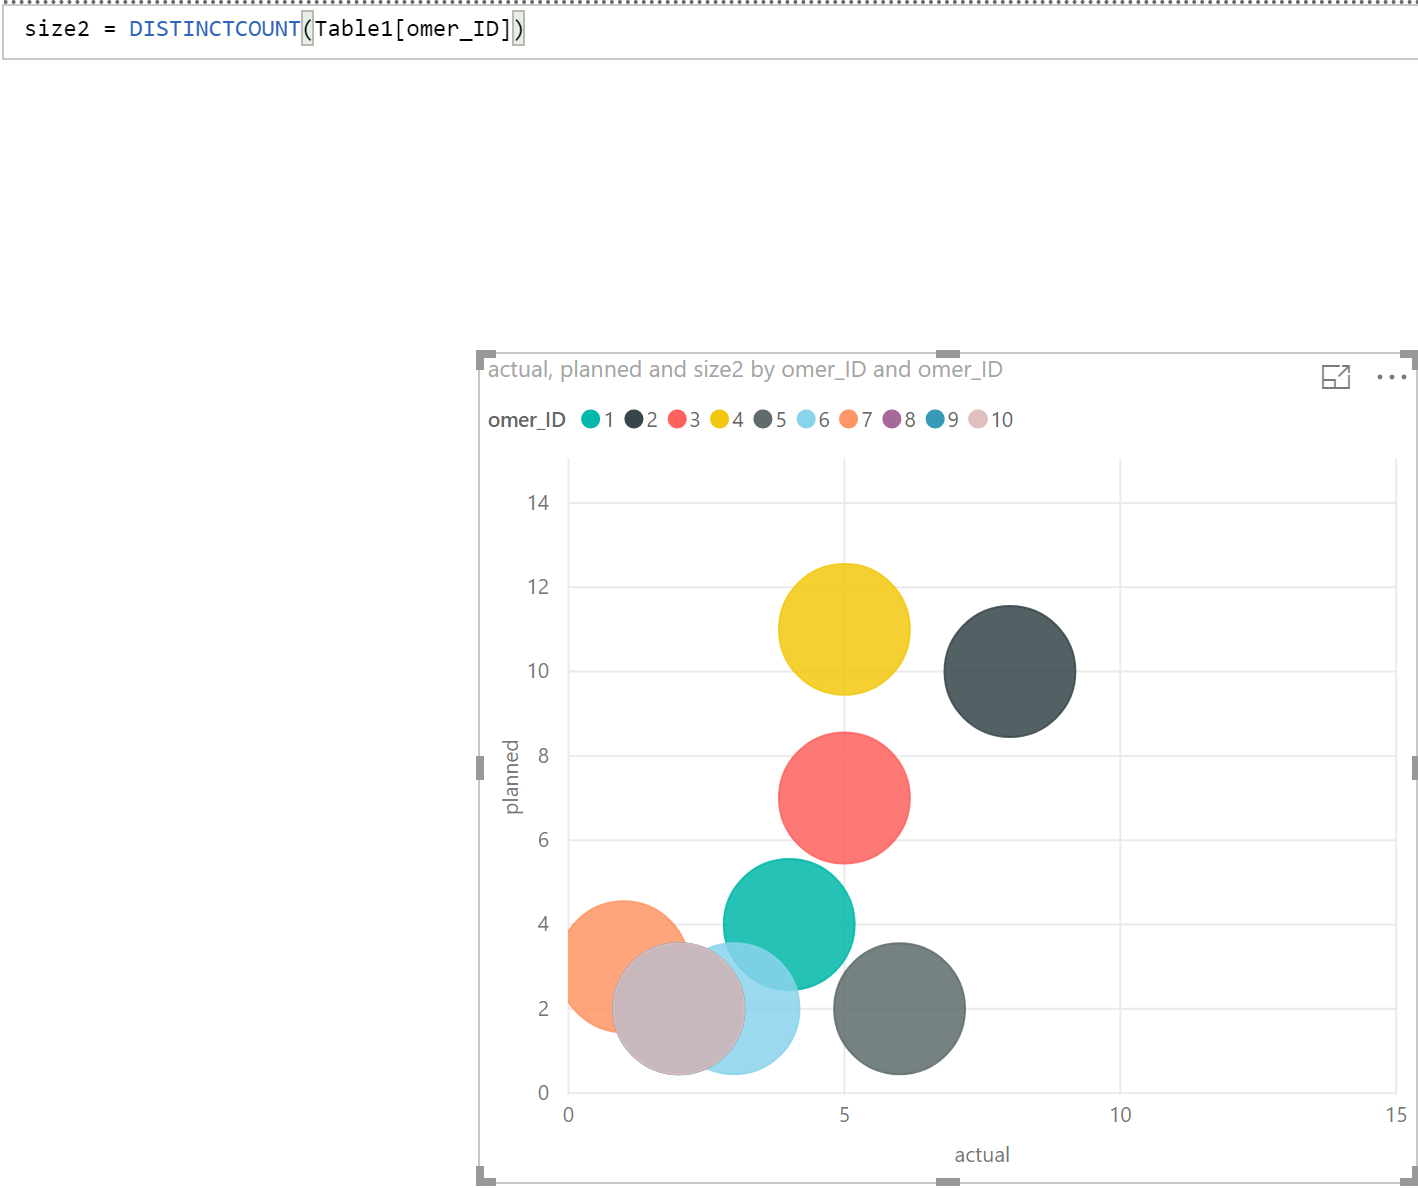
What is wrong in my DAX ? 


Thanks

avatar user

Helpful resources

Announcements
March PBI video - carousel

Power BI Monthly Update - March 2025

Check out the March 2025 Power BI update to learn about new features.

March2025 Carousel

Fabric Community Update - March 2025

Find out what's new and trending in the Fabric community.

Top Solution Authors (Last Month)
Top Kudoed Authors (Last Month)