Hi! I've got two visuals built up on three interconnected tables. (stock_movements, my_date, products_sales)
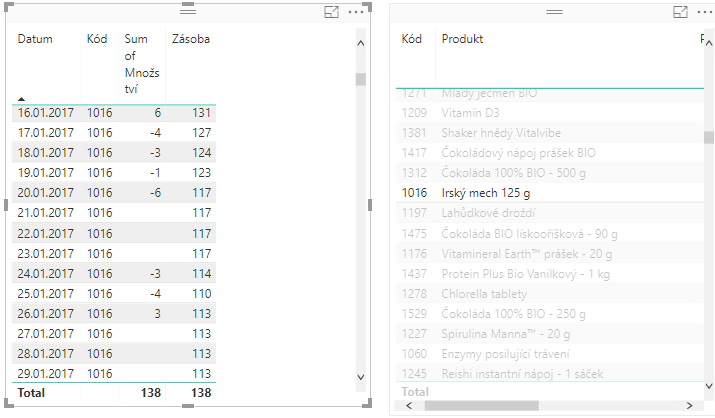
In the first visual there is:
1. Datum = my_date[Date]
2. Kód = stock_movements[Product_code]
3. Sum of Množství = custom measure summing up stock_movements[Movement]
4. Zásoba = custom measure that sums up all the previous movements before that day (basicaly running total that indicates how many products are in stock):
Zásoba =
CALCULATE(SUM(stock_movements[Movement]);
filter( all(my_date_stock_movement);
my_date_stock_movement[Date] <= MAX(my_date_stock_movement[Date])
)
)
Works like a charm. But! I want to calculate a number of days when each products wasn't in stock (Zásoba <= 0). So I thought the easiest way would be to add a next column to the first visual that would be binary (0 or 1) and would test if Zásoba is below or above the zero:
No in stock = if([Zásoba] <= 0;1;0)
Than it should be possible to select a product from the visual on the right side so the left visual would be filtered and I would see the total of days when the product wasn't in stock in the last row of Totals.
The problem is that when I select a product from the visual on the right, it doesn't filter anything on the left:
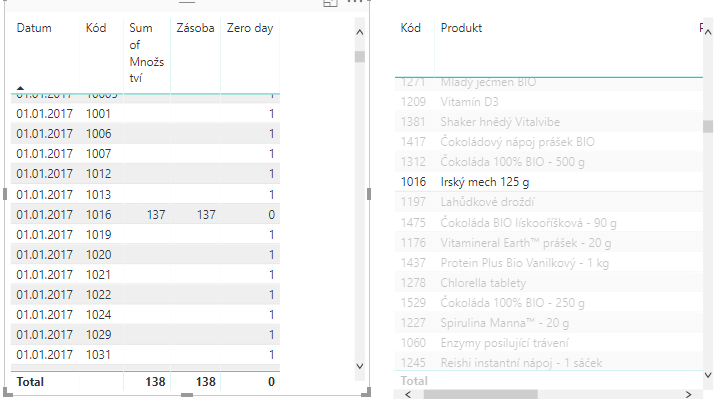
So even though the measure somehow works and brings the value 0 or 1, I still can't see that values for individual products. And it also doesn't sums up in the total row.
Do you have any idea what would help me please? Thank you for any answers!


