FabCon is coming to Atlanta
Join us at FabCon Atlanta from March 16 - 20, 2026, for the ultimate Fabric, Power BI, AI and SQL community-led event. Save $200 with code FABCOMM.
Register now!- Power BI forums
- Get Help with Power BI
- Desktop
- Service
- Report Server
- Power Query
- Mobile Apps
- Developer
- DAX Commands and Tips
- Custom Visuals Development Discussion
- Health and Life Sciences
- Power BI Spanish forums
- Translated Spanish Desktop
- Training and Consulting
- Instructor Led Training
- Dashboard in a Day for Women, by Women
- Galleries
- Data Stories Gallery
- Themes Gallery
- Contests Gallery
- QuickViz Gallery
- Quick Measures Gallery
- Visual Calculations Gallery
- Notebook Gallery
- Translytical Task Flow Gallery
- TMDL Gallery
- R Script Showcase
- Webinars and Video Gallery
- Ideas
- Custom Visuals Ideas (read-only)
- Issues
- Issues
- Events
- Upcoming Events
Get Fabric Certified for FREE during Fabric Data Days. Don't miss your chance! Request now
- Power BI forums
- Forums
- Get Help with Power BI
- Desktop
- Benchmarking - how to ensure that date in filter i...
- Subscribe to RSS Feed
- Mark Topic as New
- Mark Topic as Read
- Float this Topic for Current User
- Bookmark
- Subscribe
- Printer Friendly Page
- Mark as New
- Bookmark
- Subscribe
- Mute
- Subscribe to RSS Feed
- Permalink
- Report Inappropriate Content
Benchmarking - how to ensure that date in filter is always fixed to the minimum possible date?
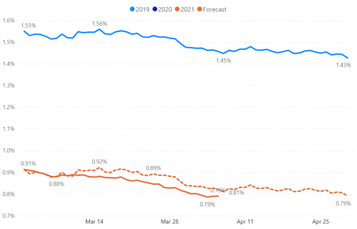
I have sort of an interesting use case that I haven't really seen here before. In short, we are trying to create a forecast that is based precisely on the trend line shape of a prior year - in our case, 2019 since 2020 is such an outlier. We want to basically say, "well, if we follow the precise trend of any given prior year (e.g. 2019), here is where we would expect to be at later in the month". In short, here is what I need to do:
1) Take the difference between the 2021 line and 2019 line on the first day of comparison. This difference should be a FIXED number throughout the entirety of the visualized period.
2) Subtract that number (for all dates in the period) from the 2019 line so that the new forecast line begins on the same start date and value as the actual 2021 line. Here's an example:
As you can see, the orange dashed line has the same shape as 2019, but is benchmarked against the .91% value on March 1st, 2021.
So far, so good. But I have another requirement; I need to be able to shift the benchmark to any day of the user's choosing within the specified time period (for this visualization it will always be the most recent two months). And this is the part that I have been having a lot of trouble with. I was only able to achieve the above visualization by fixing the date as being equal to DATE(2021,3,1), but when I try using a function like MIN() or FIRSTDATE(), the date used in the function is not the first date in the period here. Here is the measure I am using to benchmark to 3/1/2021 right now in the above screenshot:
Solved! Go to Solution.
- Mark as New
- Bookmark
- Subscribe
- Mute
- Subscribe to RSS Feed
- Permalink
- Report Inappropriate Content
Hi, I was able to solve this and achieve my objective with the following measure:
- Mark as New
- Bookmark
- Subscribe
- Mute
- Subscribe to RSS Feed
- Permalink
- Report Inappropriate Content
Hi, I was able to solve this and achieve my objective with the following measure:
- Mark as New
- Bookmark
- Subscribe
- Mute
- Subscribe to RSS Feed
- Permalink
- Report Inappropriate Content
Sounds like an excellent scenario for the What-If parameters in Power BI. You can sense the delta range for the parameter from your fact data, and then allow the user to play with values between the min and max differences (which would shift the line up and down as you require)
Helpful resources

Power BI Monthly Update - November 2025
Check out the November 2025 Power BI update to learn about new features.

Fabric Data Days
Advance your Data & AI career with 50 days of live learning, contests, hands-on challenges, study groups & certifications and more!


